范围过滤器5分钟买卖策略
Author: 雨幕(youquant), Date: 2022-06-14 11:48:03Tags: EMA
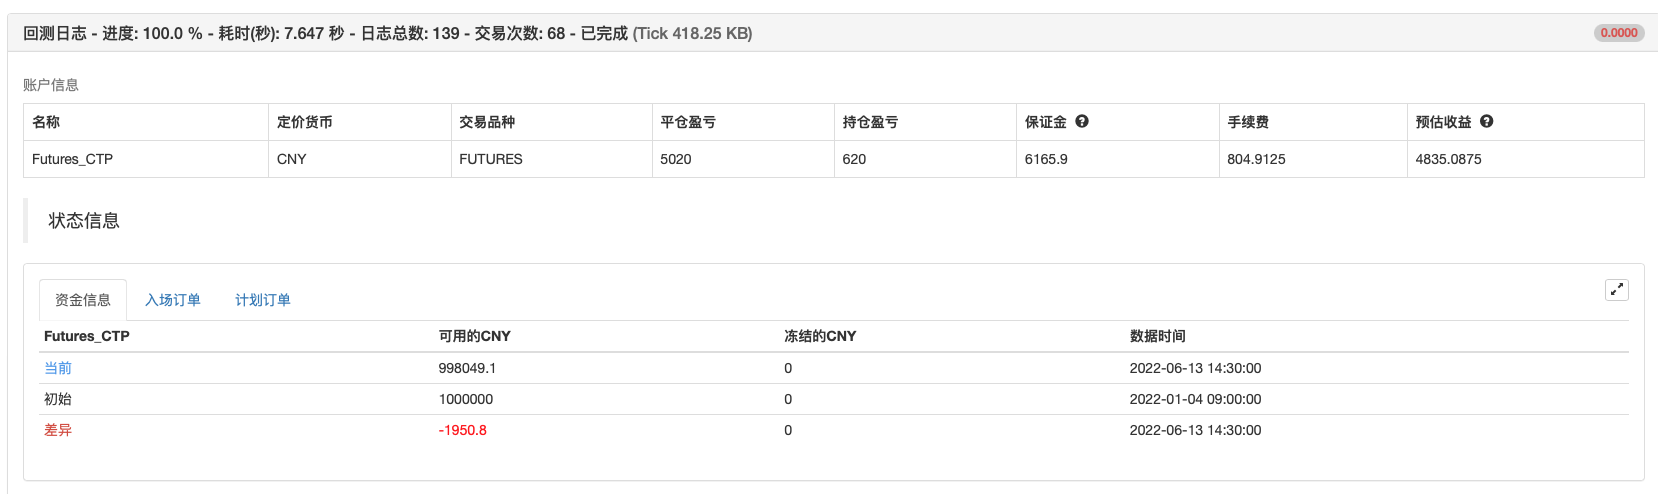
回测测试


/*backtest
start: 2022-01-01 09:00:00
end: 2022-06-13 15:00:00
period: 30m
basePeriod: 15m
exchanges: [{"eid":"Futures_CTP","currency":"FUTURES"}]
args: [["ContractType","rb888",360008]]
*/

//@version=3
strategy(title="Range Filter Buy and Sell 5min [Strategy]", overlay=true)
sources = input(defval=close, title="数据源")
isHA = input(false, "使用 HA", bool)
src = isHA ? security(heikenashi(tickerid), period, sources) : sources
// Sampling Period
// Settings for 5min chart, BTCUSDC. For Other coin, change the paremeters

per = input(defval=50, minval=1, title="采样周期")

// Range Multiplier

mult = input(defval=3.0, minval=0.1, title="范围乘数")

// Smooth Average Range

smoothrng(x, t, m)=>
    wper      = (t*2) - 1
    avrng     = ema(abs(x - x[1]), t)
    smoothrng = ema(avrng, wper)*m
    smoothrng
smrng = smoothrng(src, per, mult)

// Range Filter

rngfilt(x, r)=>
    rngfilt  = x
    rngfilt := x > nz(rngfilt[1]) ? ((x - r) < nz(rngfilt[1]) ? nz(rngfilt[1]) : (x - r)) : ((x + r) > nz(rngfilt[1]) ? nz(rngfilt[1]) : (x + r))
    rngfilt
filt = rngfilt(src, smrng)

// Filter Direction

upward   = 0.0
upward  := filt > filt[1] ? nz(upward[1]) + 1 : filt < filt[1] ? 0 : nz(upward[1])
downward = 0.0
downward := filt < filt[1] ? nz(downward[1]) + 1 : filt > filt[1] ? 0 : nz(downward[1])

// Target Bands

hband = filt + smrng
lband = filt - smrng

// Colors

filtcolor = upward > 0 ? lime : downward > 0 ? red : orange
barcolor  = (src > filt) and (src > src[1]) and (upward > 0) ? lime : (src > filt) and (src < src[1]) and (upward > 0) ? green :
   (src < filt) and (src < src[1]) and (downward > 0) ? red : (src < filt) and (src > src[1]) and (downward > 0) ? maroon : orange

filtplot = plot(filt, color=filtcolor, linewidth=3, title="Range Filter")

// Target

hbandplot = plot(hband, color=aqua, transp=100, title="High Target")
lbandplot = plot(lband, color=fuchsia, transp=100, title="Low Target")

// Fills

fill(hbandplot, filtplot, color=aqua, title="High Target Range")
fill(lbandplot, filtplot, color=fuchsia, title="Low Target Range")

// Bar Color

//barcolor(barcolor)

// Break Outs

longCond = na
shortCond = na
longCond := ((src > filt) and (src > src[1]) and (upward > 0)) or ((src > filt) and (src < src[1]) and (upward > 0))
shortCond := ((src < filt) and (src < src[1]) and (downward > 0)) or ((src < filt) and (src > src[1]) and (downward > 0))

CondIni = 0
CondIni := longCond ? 1 : shortCond ? -1 : CondIni[1]
longCondition = longCond and CondIni[1] == -1
shortCondition = shortCond and CondIni[1] == 1

plotshape(longCondition, title = "Buy Signal", text ="BUY", textcolor = white, style=shape.labelup, size = size.normal, location=location.belowbar, color = green, transp = 0)
plotshape(shortCondition, title = "Sell Signal", text ="SELL", textcolor = white, style=shape.labeldown, size = size.normal, location=location.abovebar, color = red, transp = 0)

// === Stop LOSS ===
useStopLoss = input(false, title='----- 使用 止损 / 止盈 -----', type=bool)
sl_inp = input(100, title='止损 %', type=float, step=0.25)/100
tp_inp = input(1.5, title='止盈 %', type=float, step=0.25)/100
stop_level = strategy.position_avg_price * (1 - sl_inp)
take_level = strategy.position_avg_price * (1 + tp_inp)
stop_level_short = strategy.position_avg_price * (1 + sl_inp)
take_level_short = strategy.position_avg_price * (1 - tp_inp)
// === Stop LOSS ===

if useStopLoss
    strategy.exit("Stop Loss/Profit Long","Long", stop=stop_level, limit=take_level)
    strategy.exit("Stop Loss/Profit Short","Short", stop=stop_level_short, limit=take_level_short)
if longCondition
    strategy.entry("buy", strategy.long)
else if shortCondition
    strategy.entry("sell", strategy.short)
相关内容
- 双重范围过滤器策略
- 倒锤策略(扩展选项)
- K的反转指示器I
- 吕神简易波动率策略Pine语言版本
- 3EMA + Boullinger + PIVOT 策略
- Williams%R-平滑策略
- EMA和ADX的三倍超趋势策略
- Ichimoku云平滑振荡策略
- 买/卖启动策略
- RSI-买卖信号策略
更多内容