Fukuiz趋势
Author: 雨幕, Date: 2022-05-19 14:20:27Tags: RSI RMA Pivot
该指标基于2个不同时期的RSI。
RSI简介
相对强弱指数(RSI)是技术分析中使用的动量指标,用于衡量最近价格变化的幅度,以评估股票或其他资产价格的超买或超卖情况。RSI显示为振荡器(在两个极端之间移动的折线图),读数范围为0到100。该指标最初由J.Welles Wilder Jr.开发,并在其1978年的开创性著作《技术交易系统的新概念》中介绍。
RSI的传统解释和用法是,70或以上的值表示证券正在超买或被高估,可能会出现趋势逆转或价格回调。RSI读数为30或以下表示超卖或低估情况。
在此指示器中
我知道你可以用2个不同周期的RSI来表示看涨趋势和看跌趋势。
短RSI和长RSI交叉之间的条件
- 上穿=看涨(牛市)趋势(蓝色区域)
- 下穿=看跌(熊市)趋势(红色区域)
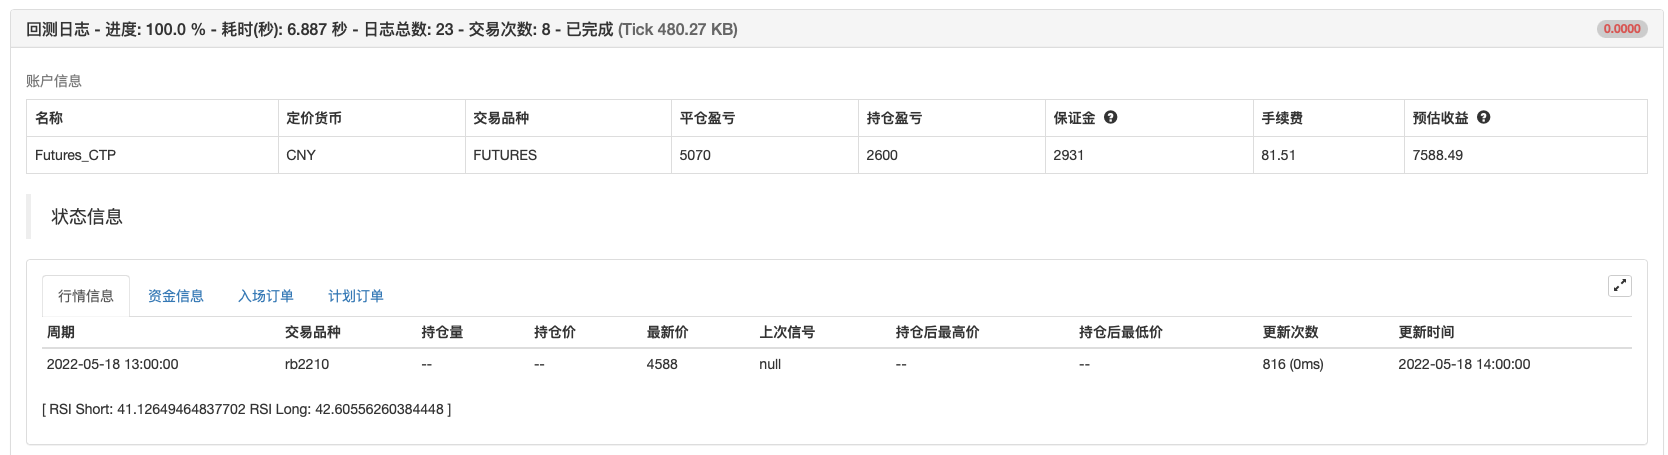
/*backtest
start: 2021-12-01 09:00:00
end: 2022-05-18 15:00:00
period: 1h
basePeriod: 15m
exchanges: [{"eid":"Futures_CTP","currency":"FUTURES"}]
args: [["ContractType","rb888",360008]]
*/
//@version=5
//Fukuiz
indicator(title='Fukuiz Trend', shorttitle='Fukuiz Trend', format=format.price, precision=2, timeframe='')
//color//
colorwhite = #FFFFFF
colorblue = #6633FF
colorred = #FF3333
colorblue2 = #33CCFF
colorpink = #FF3366
//Fuction//
len = input.int(15, minval=1, title='RSI短周期')
len2 = input.int(30, minval=1, title='RSI长周期')
src = input(close, '数据源')
up = ta.rma(math.max(ta.change(src), 0), len)
down = ta.rma(-math.min(ta.change(src), 0), len)
up2 = ta.rma(math.max(ta.change(src), 0), len2)
down2 = ta.rma(-math.min(ta.change(src), 0), len2)
rsi = down == 0 ? 100 : up == 0 ? 0 : 100 - 100 / (1 + up / down)
rsi2 = down2 == 0 ? 100 : up2 == 0 ? 0 : 100 - 100 / (1 + up2 / down2)
Bullish = rsi > rsi2
Bearish = rsi < rsi2
Fukuizcolor = Bullish ? color.new(colorblue,0) : Bearish ? color.new(colorred,0) : na
Fukuizcolor2 = Bullish ? color.new(colorblue2,0) : Bearish ? color.new(colorpink,0) : na
Fukuizcolor3 = Bullish ? color.new(colorblue,75) : Bearish ? color.new(colorred,75) : na
//Plot//
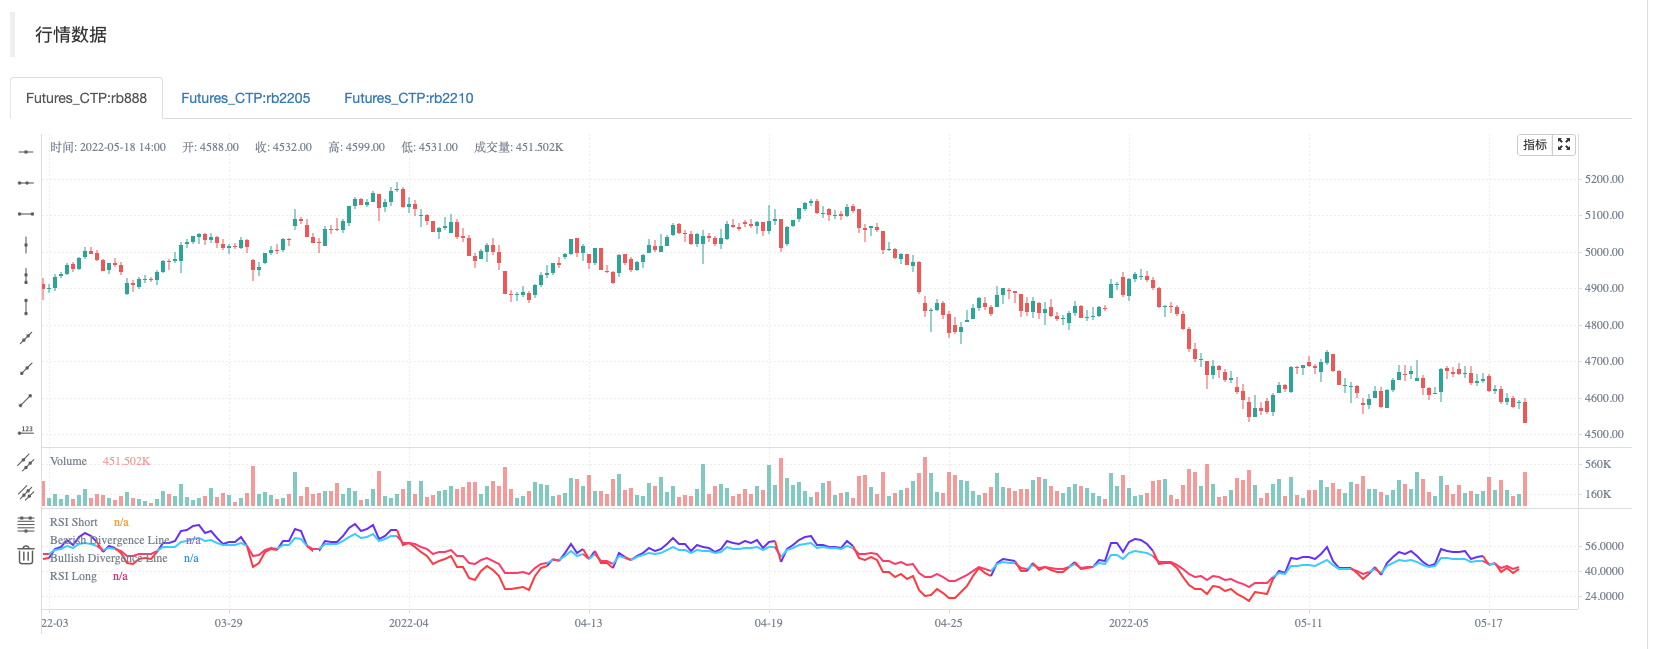
l1 = plot(rsi, 'RSI Short', color=Fukuizcolor, linewidth=2, style=plot.style_line)
l2 = plot(rsi2, 'RSI Long', color=Fukuizcolor2, linewidth=2, style=plot.style_line)
band2 = hline(50, 'Middle Band', color=#FFCC99)
band1 = hline(70, 'Upper Band', color=#FFCC99)
band0 = hline(30, 'Lower Band', color=#FFCC99)
fill(band1, band0, color.new(#0946CA, 90), title='Background')
fill(l1, l2, color=Fukuizcolor3, title='Trend Background')
//DIVERGENCE//
lbR = input(title='枢轴点回看右侧', defval=5)
lbL = input(title='枢轴点回看左侧', defval=5)
rangeUpper = input(title='最大回看范围', defval=10)
rangeLower = input(title='最小回看范围', defval=5)
plotBull = input(title='牛市背离', defval=true)
plotBear = input(title='熊市背离', defval=true)
bearColor = color.red
bullColor = color.green
hiddenBullColor = color.new(color.green, 80)
hiddenBearColor = color.new(color.red, 80)
textColor = color.white
noneColor = color.new(color.white, 100)
osc = ta.rsi(src, len)
plFound = na(ta.pivotlow(osc, lbL, lbR)) ? false : true
phFound = na(ta.pivothigh(osc, lbL, lbR)) ? false : true
_inRange(cond) =>
bars = ta.barssince(cond == true)
rangeLower <= bars and bars <= rangeUpper
oscHL = osc[lbR] > ta.valuewhen(plFound, osc[lbR], 1) and _inRange(plFound[1])
priceLL = low[lbR] < ta.valuewhen(plFound, low[lbR], 1)
bullCond = plotBull and priceLL and oscHL and plFound
plot(plFound ? osc[lbR] : na, offset=-lbR, title='Bullish Divergence Line', linewidth=2, color=bullCond ? bullColor : noneColor,display=display.none)
plotshape(bullCond ? osc[lbR] : na, offset=-lbR, title='Bullish Divergence Label', text=' Bull ', style=shape.labelup, location=location.absolute, color=color.new(bullColor, 0), textcolor=color.new(textColor, 0))
oscLH = osc[lbR] < ta.valuewhen(phFound, osc[lbR], 1) and _inRange(phFound[1])
priceHH = high[lbR] > ta.valuewhen(phFound, high[lbR], 1)
bearCond = plotBear and priceHH and oscLH and phFound
plot(phFound ? osc[lbR] : na, offset=-lbR, title='Bearish Divergence Line', linewidth=2, color=bearCond ? bearColor : noneColor,display=display.none)
plotshape(bearCond ? osc[lbR] : na, offset=-lbR, title='Bearish Divergence Label', text=' Bear ', style=shape.labeldown, location=location.absolute, color=color.new(bearColor, 0), textcolor=color.new(textColor, 0))
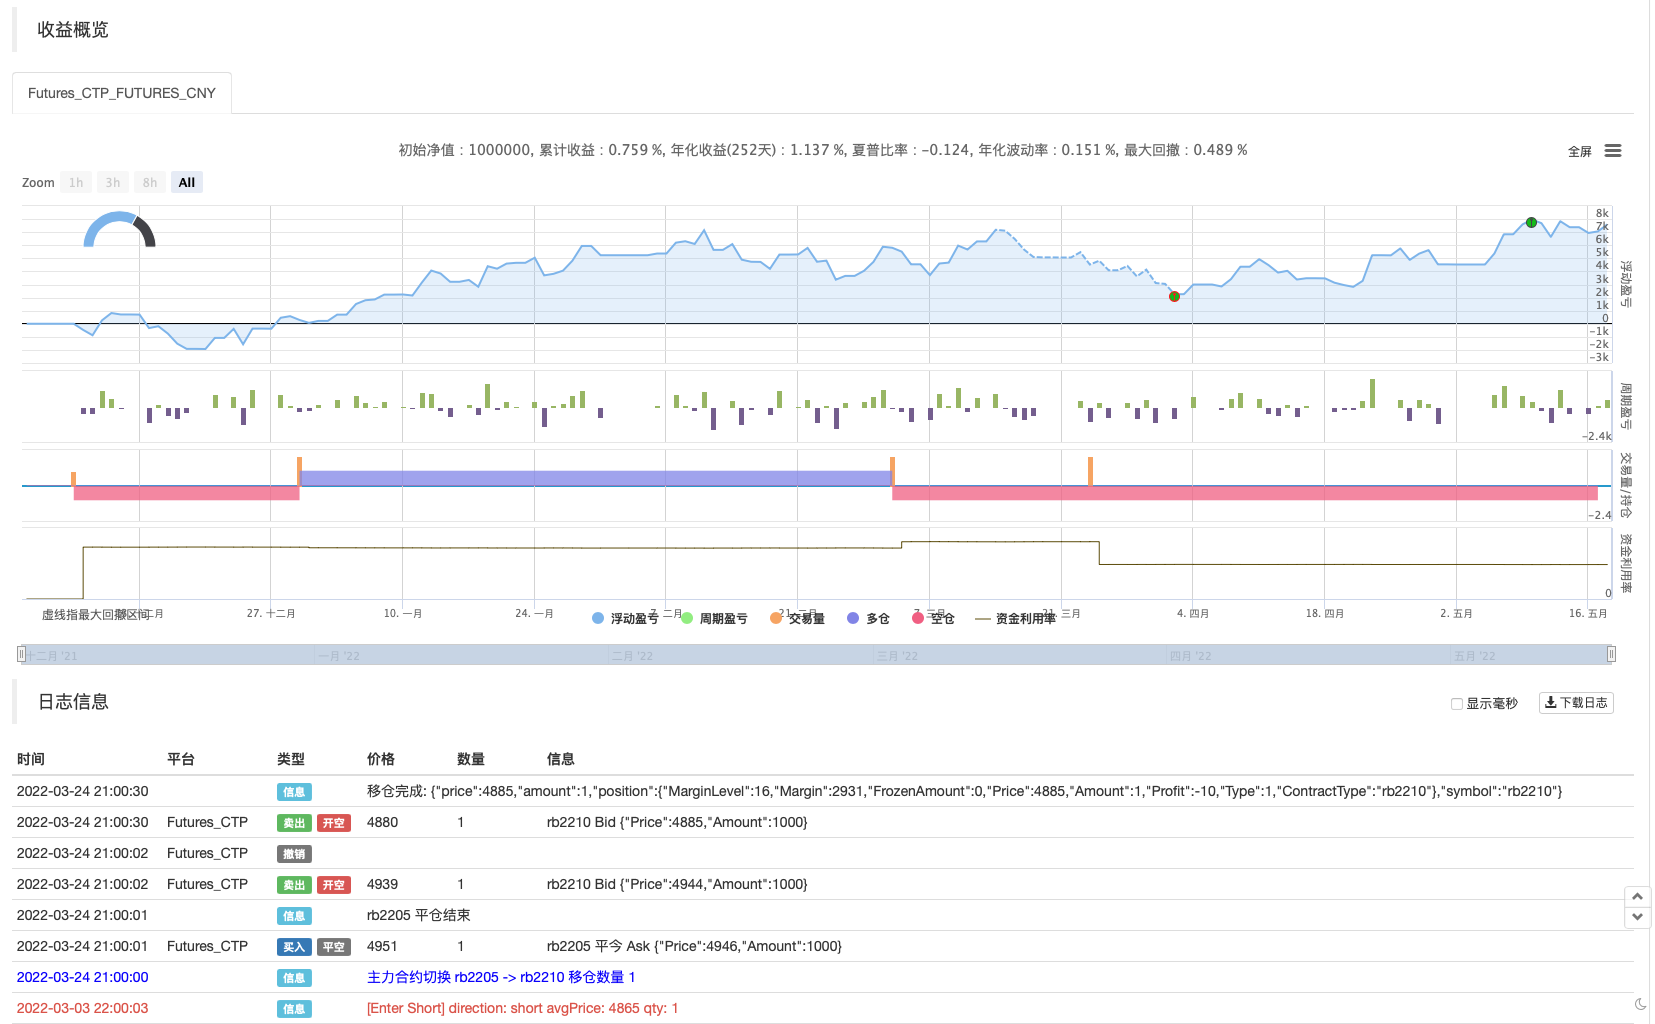
if bullCond
strategy.entry("Enter Long", strategy.long)
else if bearCond
strategy.entry("Enter Short", strategy.short)
相关内容
- zdmre的RSI策略
- RSI MTF Ob+Os策略
- VuManChu密码B + 差异策略
- 超级投机者
- RSI和BBand同时超卖
- BRAHMASTRA
- 枢轴点超级趋势
- BB-RSI-ADX指标入场点策略
- CCI+EMA与RSI交叉策略
- 大鲷鱼警报R3.0+柴金波动条件+TP RSI
更多内容