带MACD/EMA确认的高低点摆动策略
Author: 雨幕, Date: 2022-05-27 14:05:41Tags: MACD EMA
KaizenTraderB的带MACD/EMA确认的高低点摆动策略。
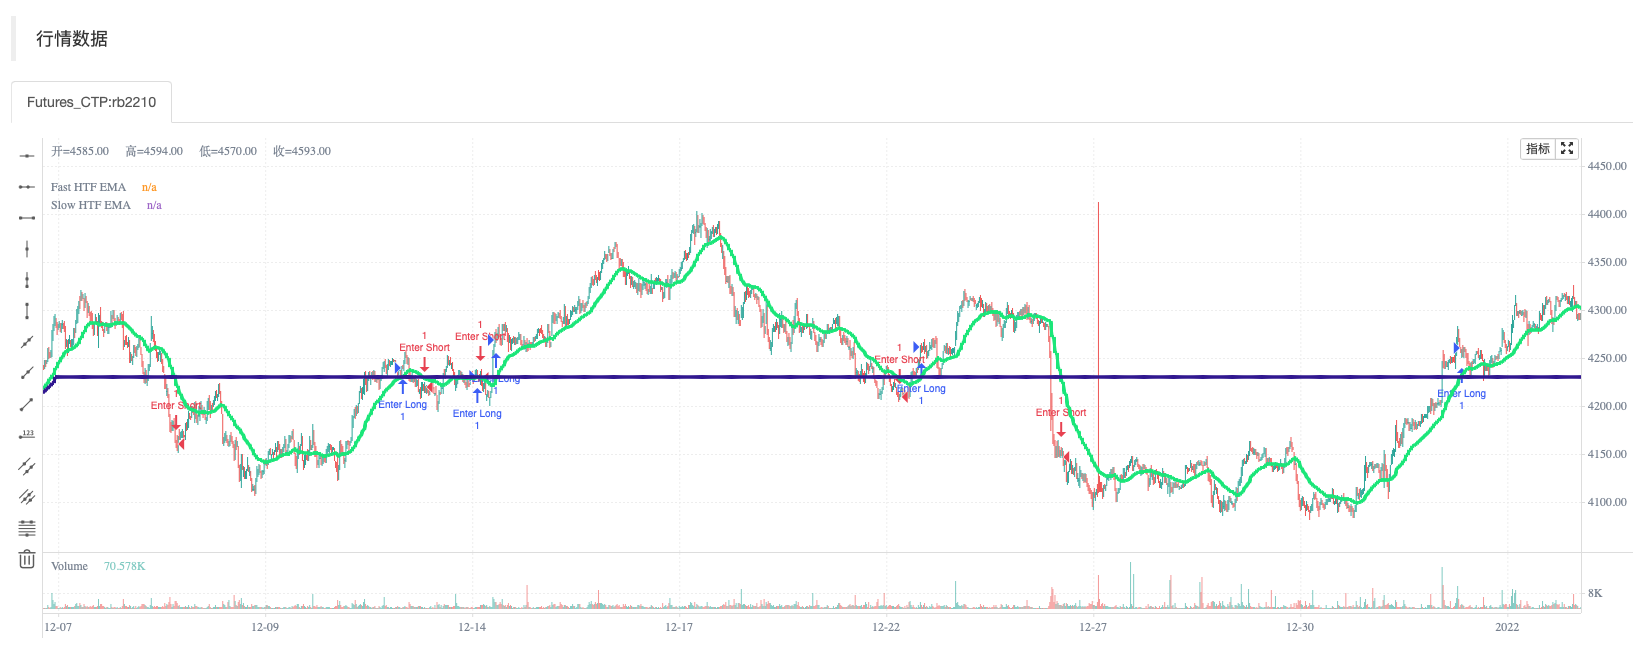
我设计这个指标是为了配合市场结构突破策略。 它标记MACD确认的波动高点和低点。 它还显示更高的时间范围快速和慢速EMA,以确定方向偏差。 还提供警报,指示下跌趋势中的低谷摆动和上升趋势中的高谷摆动。 它在最后一次上下摆动时画一条水平线。
在输入时间段上显示此指示器,并在设置中选择较高的时间段。 您还可以更改波动高点和低点以及均线的回溯期。
当我使用它时,我在寻找HTF趋势方向上的摆动高/低突破 然后,寻找突破价格水平和流动性区域(wicks、order Block、price拥塞)之间的回调,以进入均线趋势。
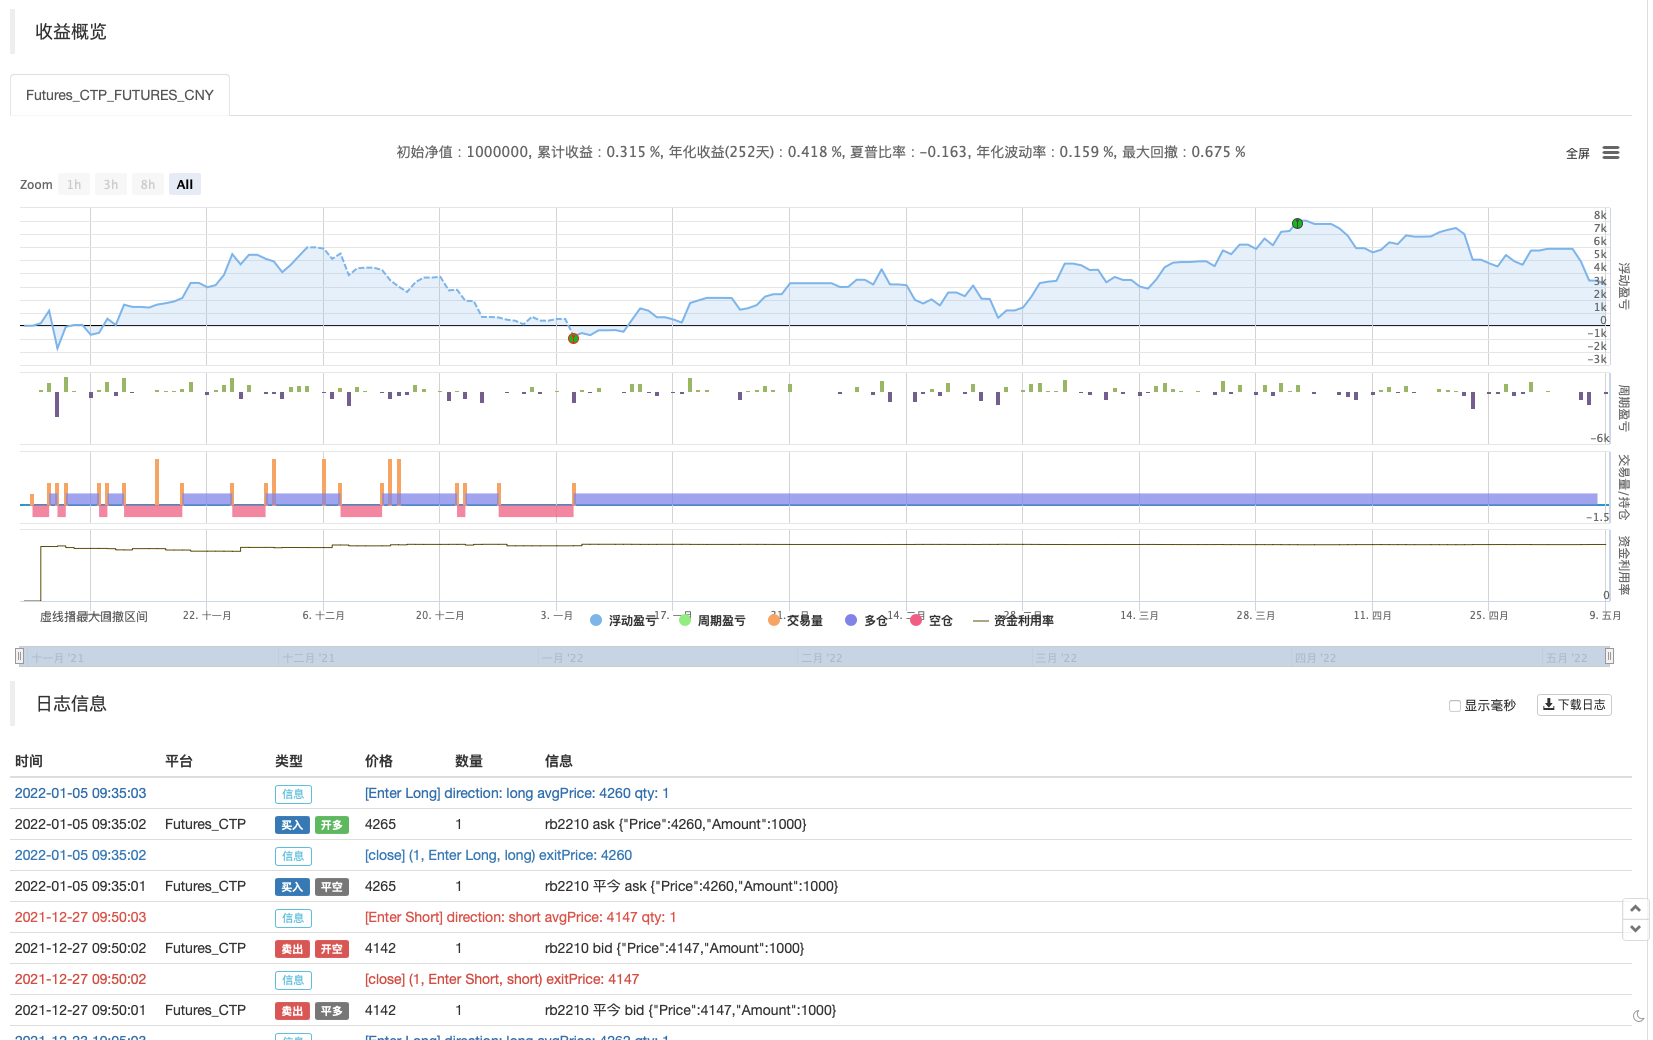
回测测试
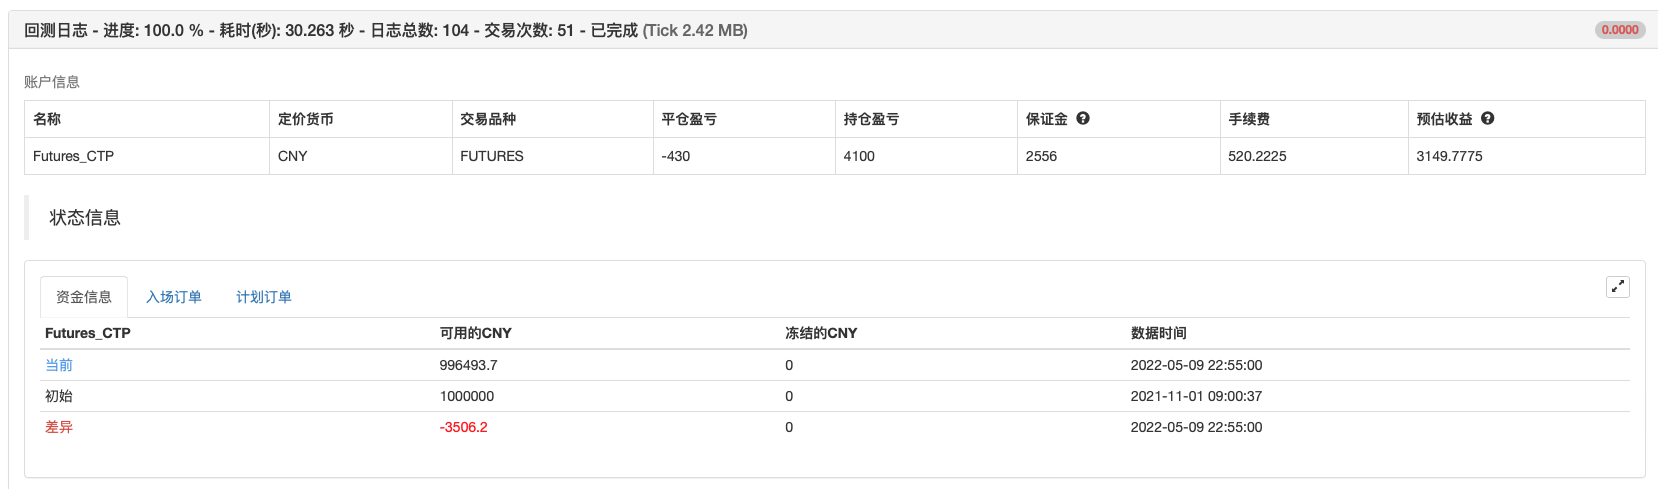
/*backtest
start: 2021-11-01 00:00:00
end: 2022-05-09 23:59:00
period: 5m
basePeriod: 1m
exchanges: [{"eid":"Futures_CTP","currency":"FUTURES"}]
args: [["v_input_1",3],["ContractType","rb2210",360008]]
*/

// Swing High/Low Indicator w/ MACD and EMA Confirmations by KaizenTraderB
//
//I designed this indicator to be used with a market structure break strategy.
//It labels swing highs and lows that are confirmed by the MACD.
//It also displays a higher timeframe Fast and Slow EMA to determine directional bias.
//Also provides alerts that signal Swing Low breaks in downtrends and Swing High Breaks in uptrends.
//It draws a horizontal line on the last Swing High and Low.
//
//Display this indicator on your entry timeframe and choose your Higher Timeframe in settings.
//You can also change lookback period for Swing Highs and Lows and EMA's.
//
//@version=4
study("Swing High/Low Indicator w/ MACD and HTF EMA's", overlay=true)

barsback = input(5, title='检查摆动回看BAR数')
showsig = input(true, title='显示信号标记')
res = input(title="EMA 时间周期", defval="15")
flen = input(title="快线 EMA 周期", type=input.integer, defval=12)
slen = input(title="慢线 EMA 周期", type=input.integer, defval=20)
showema = input(title="显示EMA的", type=input.bool, defval=true)
// showentry = input(title="显示摆动突破进入等级", type=input.bool, defval=true)

//HTF EMA's

fema = ema(close, flen)
sema = ema(close, slen)

rp_security(_symbol, _res, _src, _gaps, _lookahead) => security(_symbol, _res, _src[barstate.isrealtime ? 1 : 0], _gaps, _lookahead)

femaSmooth = rp_security(syminfo.tickerid, res, fema, barmerge.gaps_on, barmerge.lookahead_off)
semaSmooth = rp_security(syminfo.tickerid, res, sema, barmerge.gaps_on, barmerge.lookahead_off)
plot(showema ? femaSmooth : na,"Fast HTF EMA", color.lime, 3)
plot(showema ? semaSmooth : na,"Slow HTF EMA", color.navy, 3)

downtrend = femaSmooth < semaSmooth
uptrend = femaSmooth > semaSmooth

//Swing Highs and Lows
////////////////////////////////////////////////////////////////////////////////
//Thank you Backtest-Rookies.com for the Swing Detection Indicator code

swing_detection(index)=>
    swing_high = false
    swing_low = false
    start = (index*2) - 1 // -1 so we have an even number of
    swing_point_high = high[index]
    swing_point_low = low[index]

    //Swing Highs
    for i = 0 to start
        swing_high := true
        if i < index
            if high[i] > swing_point_high
                swing_high := false
                break
        // Have to do checks before pivot and after seperately because we can get
        // two highs of the same value in a row. Notice the > and >= difference
        if i > index
            if high[i] >= swing_point_high
                swing_high := false
                break

    //Swing lows
    for i = 0 to start
        swing_low := true
        if i < index
            if low[i] < swing_point_low
                swing_low := false
                break
        // Have to do checks before pivot and after seperately because we can get
        // two lows of the same value in a row. Notice the > and >= difference
        if i > index
            if low[i] <= swing_point_low
                swing_low := false
                break

    [swing_high, swing_low]

// Check for a swing
[swing_high, swing_low] = swing_detection(barsback)
////////////////////////////////////////////////////////////////////////////////

float swing_high_price = na
float swing_low_price = na

if swing_high
    swing_high_price := high[barsback]
if swing_low
    swing_low_price := low[barsback]

[macdline, signalline, histline] = macd(close,12,26,9)

macpos = histline[barsback] > 0
macneg = histline[barsback] < 0

// Plotting

SHPrice = "SH\n" + str.tostring(swing_high_price)
SLPrice = "SL\n" + str.tostring(swing_low_price)

if swing_high and macpos and showsig
    //SHLabel = label.new(bar_index[barsback], swing_high_price, SHPrice, xloc.bar_index, yloc.abovebar, color.red, label.style_arrowdown, textcolor=color.red, size=size.normal)
    //SHLine = line.new(bar_index[barsback], swing_high_price, bar_index[barsback] + 20, swing_high_price, xloc.bar_index, extend.none, color.black, width=2)
    //line.delete(SHLine[1])

if swing_low and macneg and showsig
    //label.new(bar_index[barsback], swing_low_price, SLPrice, xloc.bar_index, yloc.belowbar, color.green, label.style_arrowup, textcolor=color.green)
    //SLLine = line.new(bar_index[barsback], swing_low_price, bar_index[barsback] + 20, swing_low_price, xloc.bar_index, extend.none, color.black, width=2)
    //line.delete(SLLine[2])

//alerts
alertcondition(uptrend and close > swing_high_price, "Swing High Break in Uptrend", "Swing High Break!")
alertcondition(downtrend and close < swing_low_price, "Swing Low Break in Downtrend", "Swing Low Break!")

if uptrend
    strategy.entry("Enter Long", strategy.long)
else if downtrend
    strategy.entry("Enter Short", strategy.short)
相关内容
- 基于动量的ZigZag
- 三重EMA和MACD策略
- MACD威利策略
- 倒锤策略(扩展选项)
- Hull-4ema
- Ichimoku云平滑振荡策略
- Ichimoku 云平滑振荡策略
- 双重范围过滤器策略
- Heikin Ashi趋势
- Williams%R-平滑策略
更多内容