TMA-Legacy策略
Author: 雨幕(youquant), Date: 2022-06-01 16:14:23Tags: ADXRSISTOCHMOM
这是一个基于PhoenixBinary最初的TMA-RSI偏离指标的脚本。预期用途与原始用途相同,但某些计算不同,可能与原始用途的作用或信号不同。该指标的灵感来自Arty和Christy。
组件
以下是最初发布的指标的简要概述:
-
1-RSI发散 Arty使用RSI差异作为工具来寻找切入点和可能的反转。他不使用传统的超买/超卖。他用50号线。该指示器包括50线和浮动50线。 浮动50线是多时间段平滑移动平均线。价格不是线性的,因此,你的50线也不应该是线性的。 RSI线使用动态彩色算法,显示当前对市场的控制以及市场中可能的转折点。
-
2-平滑RSI发散 平滑RSI发散是一种较慢的RSI,通过不同的计算来平滑RSI线。这为价格行动提供了一个不同的视角,更多的是对趋势的长期视角。当浮动50和传统RSI交叉浮动50对齐时。
-
3-动量散度 这将需要一点时间来掌握。但是,一旦你掌握了这一点,再加上另外两个,该死的,这些条目会变得非常致命!
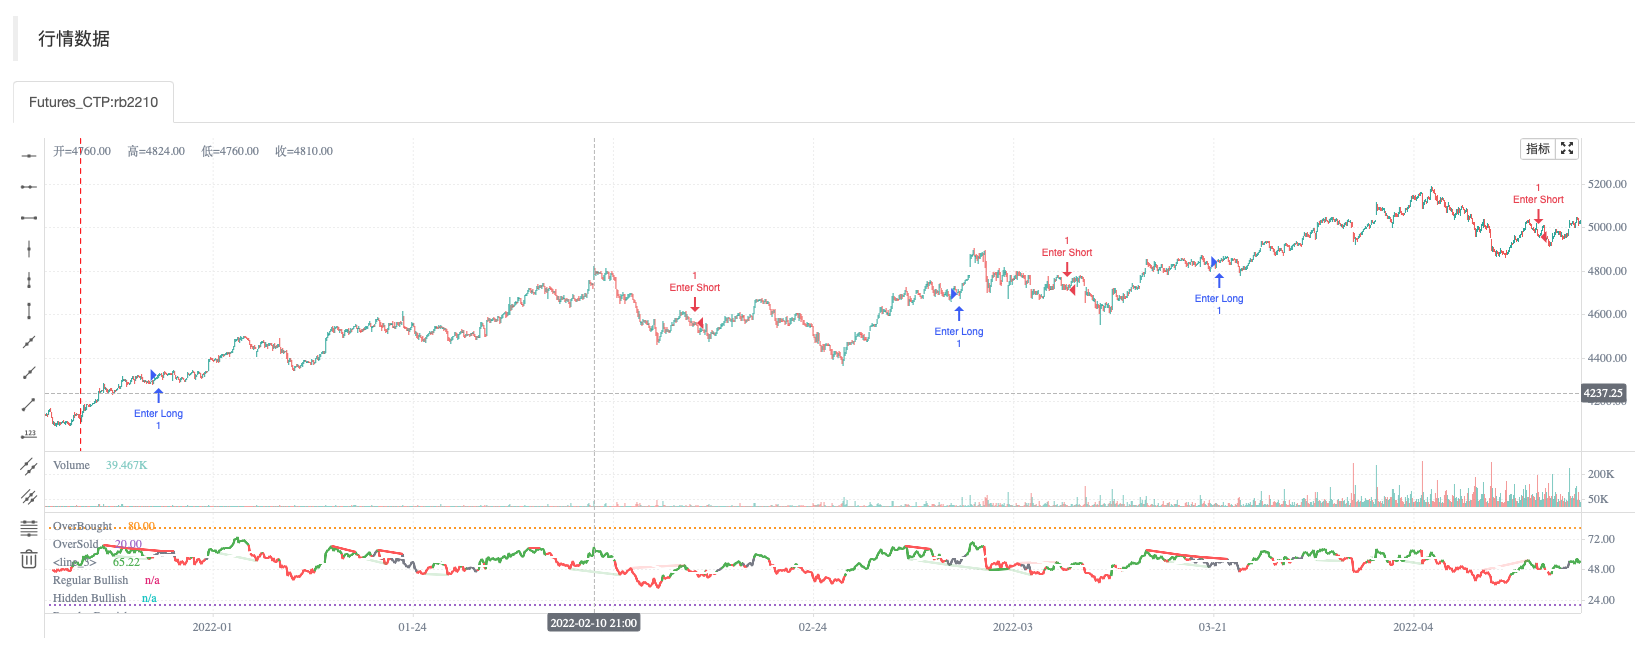
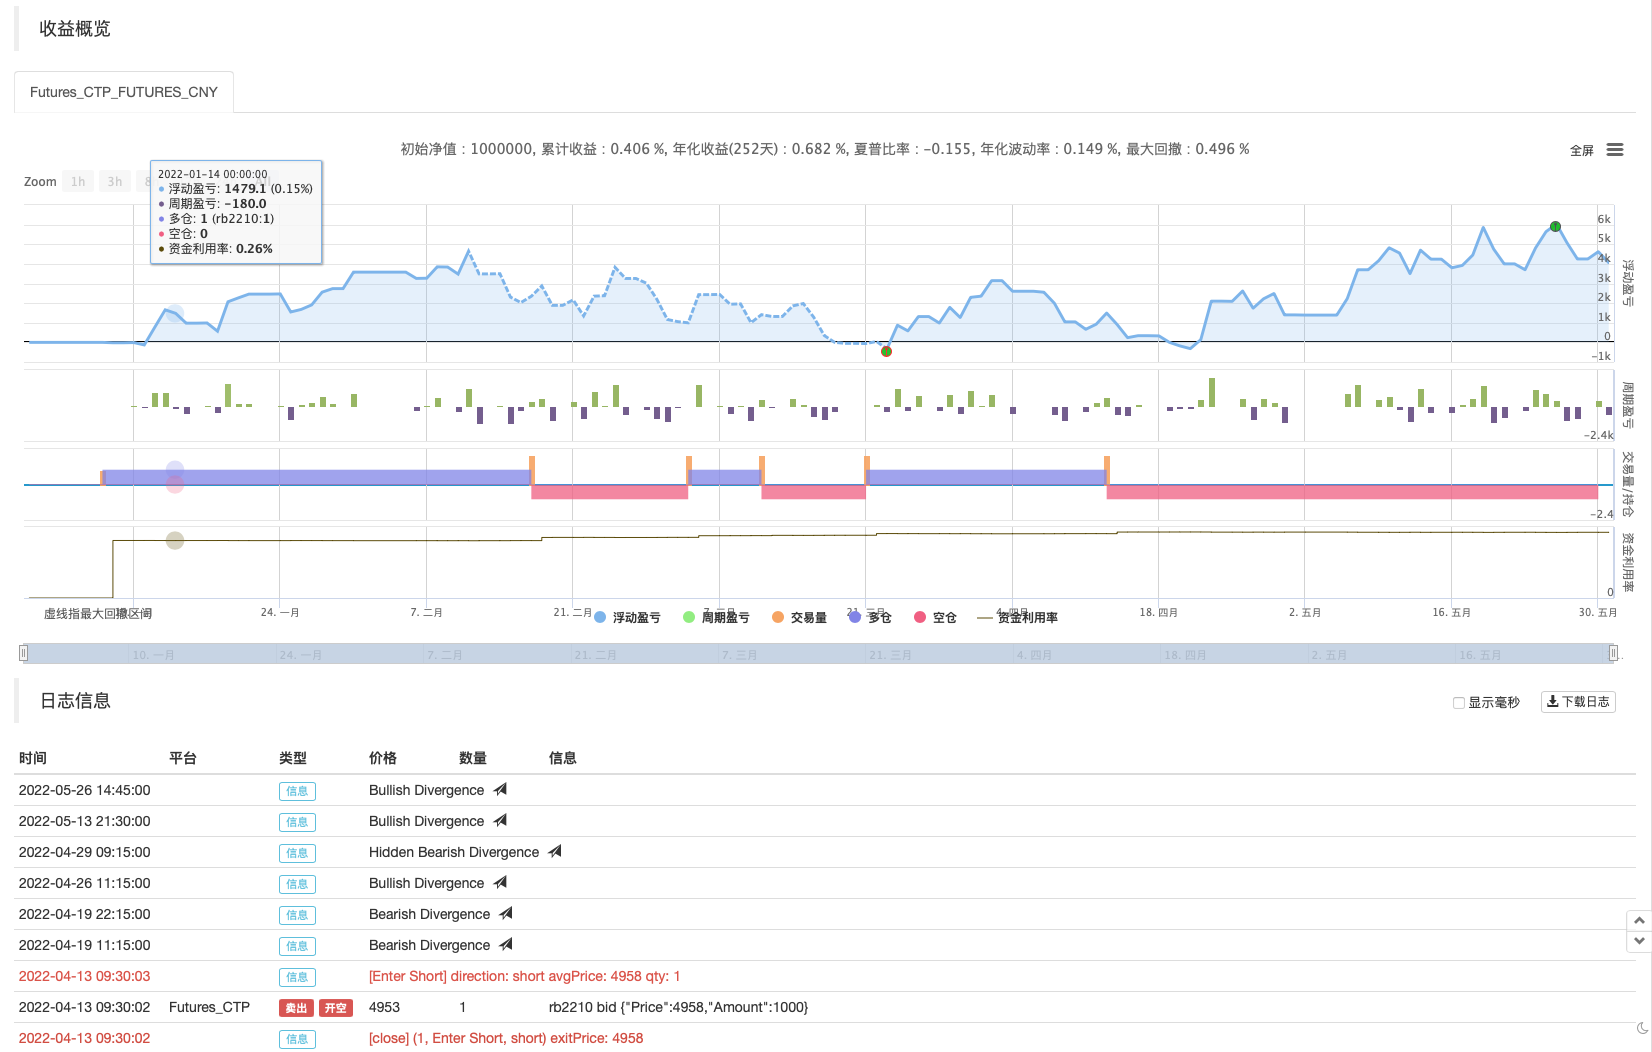
回测测试
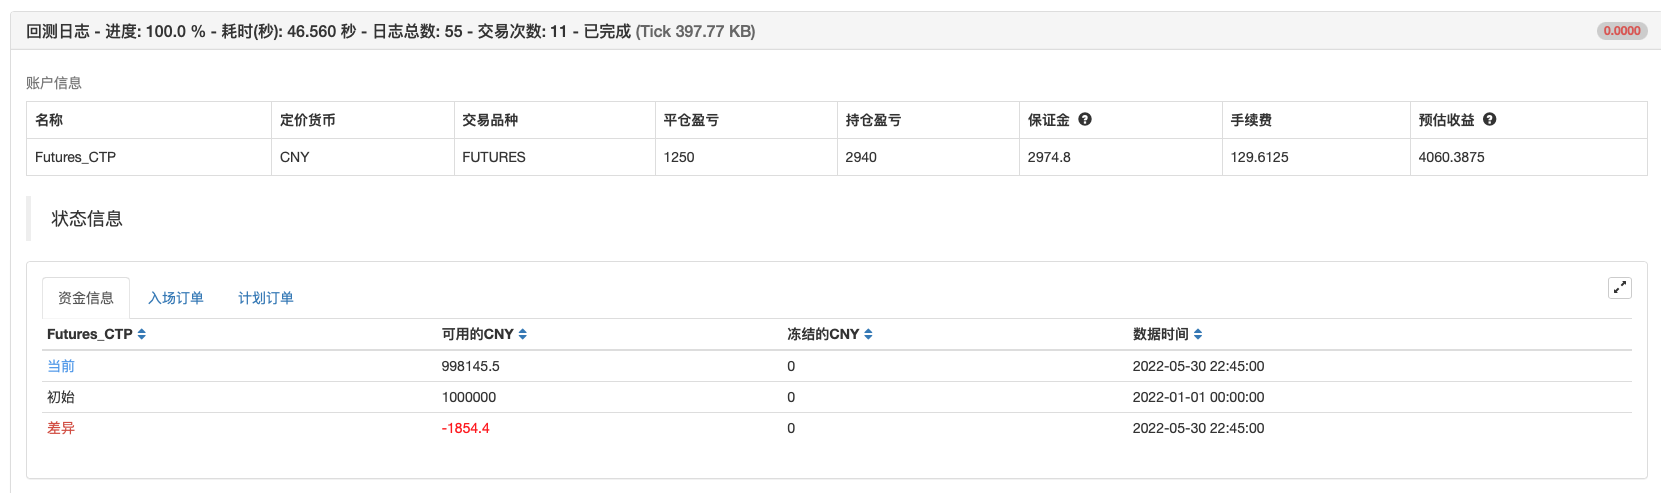
/*backtest
start: 2022-01-01 00:00:00
end: 2022-05-31 00:00:00
period: 15m
basePeriod: 5m
exchanges: [{"eid":"Futures_CTP","currency":"FUTURES"}]
args: [["v_input_int_6",10],["v_input_int_7",10],["ContractType","rb2210",360008]]
*/

//// This source code is subject to the terms of the Mozilla Public License 2.0 at https://mozilla.org/MPL/2.0/
// ©Hotchachachaa, Rest in Peace Pheonix Algo(aka Doug) your community misses you and we extend our deepest sympathies to your family.
//@version=5
//
//This indicator is based on the TMA-Divergence indicator created by PhoenixBinary for the TMA discord Community. Since Phoenix is no longer part of the community
//we did our best to recreate the indicator for the community's continued use updates and revisions.
indicator("TMA-Legacy", overlay=false)

////////////////////////////////////inputs////////////////////////////////////////////////

displayRSI = input.string(title="RSI 类型", defval="RSI Divergence", options=["RSI Divergence","RSI Smoothed","RSI Momentum"],group="Main Settings")
lenrsinordiv = input.int(title="RSI 正常周期", defval=14,minval=1, group= "RSI Normal")
lenrsismodiv = input.int(title="RSI 平滑周期", defval=40, minval=1,group = "RSI Smoothed" )
lenrsissmoma = input.int(title="RSI 平滑均线周期", defval=40,minval=1, group = "RSI Smoothed" )
lenrsimomdiv = input.int(title="RSI 正常周期", defval=5 ,minval=1, group = "RSI Momentum")
rsimommalen = input.int(34, minval=1, title="RSI平滑均线周期",group="RSI Momentum")
srcrsidiv = input(title="RSI 数据源", defval=close, group="Main Settings")
lbR = input.int(title="枢轴点右回看周期", defval=10,minval=1,group="Divergence Spotter")
lbL = input.int(title="枢轴点左回看周期", defval=10,minval=1,group="Divergence Spotter")
rangeUpper = input.int(title="最大回看范围", defval=60,minval=1,group="Divergence Spotter")
rangeLower = input.int(title="最小回看范围", defval=5,minval=1,group="Divergence Spotter")
plotBull = input.bool(title="画图 看涨趋势", defval=true,group="Divergence Spotter")
plotHiddenBull = input.bool(title="隐藏 画图 看涨趋势", defval=true,group="Divergence Spotter")
plotBear = input.bool(title="画图 看跌趋势", defval=true,group="Divergence Spotter")
plotHiddenBear = input.bool(title="隐藏 画图 看跌趋势", defval=true,group="Divergence Spotter")
bearColorrsidiv = color.red
bullColorrsidiv = color.green
hiddenBullColor = color.new(color.green, 80)
hiddenBearColor = color.new(color.red, 80)
textColor = color.white
noneColor = color.new(color.white, 100)
lenDisplay= displayRSI == "RSI Divergence" ? lenrsinordiv: displayRSI == "RSI Smoothed" ? lenrsismodiv: na
rsiValue1 = ta.rsi(srcrsidiv, lenrsinordiv)

// ### Smoothed MA

averageSource = rsiValue1
typeofMA1 = "SMMA"
length_ma1 = 50
f_smma(averageSource, averageLength) =>
    smma = 0.0
    smma := na(smma[1]) ? ta.sma(averageSource, averageLength) : (smma[1] * (averageLength - 1) + averageSource) / averageLength
    smma

f_smwma(averageSource, averageLength) =>
    smwma = 0.0
    smwma := na(smwma[1]) ? ta.wma(averageSource, averageLength) : (smwma[1] * (averageLength - 1) + averageSource) / averageLength
    smwma

f_tma(averageSource, averageLength) =>
    ta.sma(ta.sma(averageSource, averageLength), averageLength)

f_dema(averageSource, averageLength) =>
    emaValue = ta.ema(averageSource, averageLength)
    2 * emaValue - ta.ema(emaValue, averageLength)

f_tema(averageSource, averageLength) =>
    ema1 = ta.ema(averageSource, averageLength)
    ema2 = ta.ema(ema1, averageLength)
    ema3 = ta.ema(ema2, averageLength)
    (3 * ema1) - (3 * ema2) + ema3

f_ma(smoothing, averageSource, averageLength) =>
	switch str.upper(smoothing)
        "SMA"  => ta.sma(averageSource, averageLength)
        "EMA"  => ta.ema(averageSource, averageLength)
        "WMA"  => ta.wma(averageSource, averageLength)
        "HMA"  => ta.hma(averageSource, averageLength)
        "RMA"  => ta.rma(averageSource, averageLength)
        "SWMA" => ta.swma(averageSource)
        "ALMA" => ta.alma(averageSource, averageLength, 0.85, 6)
        "VWMA" => ta.vwma(averageSource, averageLength)
        "VWAP" => ta.vwap(averageSource)
        "SMMA" =>  f_smma(averageSource, averageLength)
        "SMWMA" =>  f_smwma(averageSource, averageLength)
        "DEMA" => f_dema(averageSource, averageLength)
        "TEMA"=>  f_tema(averageSource, averageLength)
        => runtime.error("Moving average type '" + smoothing +
             "' not found!"), na


MA1 = f_ma(typeofMA1, averageSource, length_ma1)
showNormal=displayRSI=="RSI Divergence"
showSmoothed=displayRSI=="RSI Smoothed"
showMomentum = displayRSI =="RSI Momentum"
showAll= displayRSI=="All Three"
///////OB/OS lines

hline(showNormal or showSmoothed ? 80 :na, title="OverBought", linestyle=hline.style_dotted, linewidth=2)
hline(showNormal or showSmoothed ? 20 :na, title="OverSold", linestyle=hline.style_dotted, linewidth=2)
////////////////show normal

plot(showNormal? MA1 : na , linewidth=2, color=color.white)

var int colortoken=1

color1= color.green
color2 = color.yellow
color3 = color.orange
color4 = color.red

if rsiValue1>rsiValue1[1] and colortoken!=1
    colortoken:= colortoken[1] - 1

if rsiValue1<rsiValue1[1] and colortoken!=4
    colortoken:= colortoken[1] + 1

lineColor= colortoken == 1 ? color1: colortoken ==2 ? color2 : colortoken == 3 ? color3 : colortoken == 4 ? color4 :na

plot(showNormal? rsiValue1 : na, title="RSI", linewidth=3, color=lineColor)


////////////show smoothed
lensig = input.int(14, title="ADX 平滑", minval=1, maxval=50)
len = input.int(14, minval=1, title="DI 周期")
up = ta.change(high)
down = -ta.change(low)
plusDM = na(up) ? na : (up > down and up > 0 ? up : 0)
minusDM = na(down) ? na : (down > up and down > 0 ? down : 0)
trur = ta.rma(ta.tr, len)
plus = fixnan(100 * ta.rma(plusDM, len) / trur)
minus = fixnan(100 * ta.rma(minusDM, len) / trur)
sum = plus + minus
adx = 100 * ta.rma(math.abs(plus - minus) / (sum == 0 ? 1 : sum), lensig)
rsisrc = ta.rsi(close,lenrsismodiv)
adxthreshold=input.int(title="adx",defval=15)
smoothColor= adx>adxthreshold and plus>minus? color.green:adx>adxthreshold and plus<minus?color.red : adx<adxthreshold?color.gray:na

rsismma = 0.0
rsismma := na(rsismma[1]) ? ta.sma(rsisrc, lenrsissmoma) : (rsismma[1] * (lenrsissmoma - 1) + rsisrc) / lenrsissmoma
rsiwsmma= ta.wma(rsismma,lenrsissmoma)
plot(showSmoothed ? rsisrc:na, linewidth=2, color=smoothColor)
plot(showSmoothed ? rsiwsmma:na, linewidth=2, color=color.white)


////////////////RSI momentum
///////////////////// normal RSI
rsiValue2 = ta.rsi(ohlc4,lenrsimomdiv)
rsiema = ta.wma(rsiValue2,rsimommalen)
normalizedRSI= (rsiValue2-50)/100

/////////////////// Normal Momentum
lenmom = input.int(5, minval=1, title=" MOM 周期",group= "RSI Momentum")
srcmom = ohlc4
mom = srcmom - srcmom[lenmom]

//////////stochRSI K line
smoothK = input.int(5, "K", minval=1)
lengthRSI = input.int(5, "RSI 周期", minval=1, group="RSI Momentum")
lengthStoch = input.int(34, "Stochastic 周期", minval=1,group= "RSI Momentum")
src = input(ohlc4, title="RSI 数据源",group= "RSI Momentum")
rsi1 = ta.rsi(src, lengthRSI)
k = ((ta.sma(ta.stoch(rsi1, rsi1, rsi1, lengthStoch), smoothK))-50)/100

WTF=math.avg(mom,normalizedRSI,k)
smmaLen = input.int(25, minval=1, title="SMMA 周期", group = "RSI Momentum")
smmaLen1= 2
smmaSrc = WTF
WTFsmma = 0.0
WTFsmma := na(WTFsmma[1]) ? ta.sma(smmaSrc, smmaLen1) : (WTFsmma[1] * (smmaLen1 - 1) + smmaSrc) / smmaLen1
smma = 0.0
smma := na(smma[1]) ? ta.sma(smmaSrc, smmaLen) : (smma[1] * (smmaLen - 1) + smmaSrc) / smmaLen


color1a= #0E3F01
color2a = #31FA2A
color3a = #FA6B6B
color4a = #971643

momentumColor= WTF>WTF[1] and WTF>smma ? color1a : WTF<WTF[1] and WTF>smma ? color2a : WTF>WTF[1] and WTF<smma ? color3a : WTF<WTF[1] and WTF<smma ? color4a : na


plot(showMomentum ? WTF:na, color=momentumColor, linewidth=3)
plot(showMomentum ? smma:na , linewidth=2, color=color.white)


osc= displayRSI =="RSI Divergence" ? rsiValue1 : displayRSI =="RSI Smoothed" ? rsisrc:na

///////////divergence
plFound = na(ta.pivotlow(osc, lbL, lbR)) ? false : true
phFound = na(ta.pivothigh(osc, lbL, lbR)) ? false : true
_inRange(cond) =>
	bars = ta.barssince(cond == true)
	rangeLower <= bars and bars <= rangeUpper

//------------------------------------------------------------------------------
// Regular Bullish
// Osc: Higher Low

oscHL = osc[lbR] > ta.valuewhen(plFound, osc[lbR], 1) and _inRange(plFound[1])

// Price: Lower Low

priceLL = low[lbR] < ta.valuewhen(plFound, low[lbR], 1)
bullCond = plotBull and priceLL and oscHL and plFound

plot(
     displayRSI !="RSI Momentum"and plFound ? osc[lbR] : na,
     offset=-lbR,
     title="Regular Bullish",
     linewidth=2,
     color=(bullCond ? bullColorrsidiv : noneColor)

     )


//------------------------------------------------------------------------------
// Hidden Bullish
// Osc: Lower Low

oscLL = osc[lbR] < ta.valuewhen(plFound, osc[lbR], 1) and _inRange(plFound[1])

// Price: Higher Low

priceHL = low[lbR] > ta.valuewhen(plFound, low[lbR], 1)
hiddenBullCond = plotHiddenBull and priceHL and oscLL and plFound

plot(
	 displayRSI !="RSI Momentum" and plFound ? osc[lbR] : na,
	 offset=-lbR,
	 title="Hidden Bullish",
	 linewidth=2,
	 color=(hiddenBullCond ? hiddenBullColor : noneColor)

	 )


//------------------------------------------------------------------------------
// Regular Bearish
// Osc: Lower High

oscLH = osc[lbR] < ta.valuewhen(phFound, osc[lbR], 1) and _inRange(phFound[1])

// Price: Higher High

priceHH = high[lbR] > ta.valuewhen(phFound, high[lbR], 1)

bearCond = plotBear and priceHH and oscLH and phFound

plot(
	 displayRSI !="RSI Momentum" and phFound ? osc[lbR] : na,
	 offset=-lbR,
	 title="Regular Bearish",
	 linewidth=2,
	 color=(bearCond ? bearColorrsidiv : noneColor)

	 )


//------------------------------------------------------------------------------
// Hidden Bearish
// Osc: Higher High

oscHH = osc[lbR] > ta.valuewhen(phFound, osc[lbR], 1) and _inRange(phFound[1])

// Price: Lower High

priceLH = high[lbR] < ta.valuewhen(phFound, high[lbR], 1)

hiddenBearCond = plotHiddenBear and priceLH and oscHH and phFound

plot(
	 displayRSI !="RSI Momentum" and phFound ? osc[lbR] : na,
	 offset=-lbR,
	 title="Hidden Bearish",
	 linewidth=2,
	 color=(hiddenBearCond ? hiddenBearColor : noneColor)

	 )


// ### Alerts


if bearCond
    alert("Bearish Divergence")
else if hiddenBearCond
    alert("Hidden Bearish Divergence")
else if bullCond
    alert("Bullish Divergence")
else if hiddenBullCond
    alert("Hidden Bullish Divergence")

if hiddenBullCond
    strategy.entry("Enter Long", strategy.long)
else if hiddenBearCond
    strategy.entry("Enter Short", strategy.short)


// END ###
相关内容
- BB-RSI-ADX指标入场点策略
- MTF RSI&STOCH策略
- 最佳TV策略
- Chande Kroll 止损
- RSI MTF Ob+Os策略
- zdmre的RSI策略
- Nik Stoch
- 超级投机者
- 动量2.0策略
- VuManChu密码B + 差异策略
更多内容