HA市场偏差
Author: 雨幕, Date: 2022-06-02 11:29:57Tags: HA EMA TF
大家好。我希望你们都做得很好。我已经很久没有在这里发布我的第一个脚本了,我从中得到了很多回应。
所以,我想我也应该把这个脚本分享给每个人,以及任何可能觉得有用的人。就我个人而言,我用它来告诉一般的市场情况。
以下是我的工作方式:脚本试图确定市场的整体方向,使用平滑的平根阿希蜡烛。着色系统(使用明亮和黑暗的颜色)是一种尝试,用于检测强劲的市场和疲软的市场状况。脚本中还有一个振荡器,但目前尚未绘制。感谢@jackvmk,我在这个指示器中使用了他的部分开放脚本代码。
我曾考虑使用指标图的斜率作为市场条件范围的过滤器。在“平坦”市场中,该地块相对平坦。然而,我还没有对此采取任何行动。也许改天吧。
我希望你觉得这很有用。如果您找到了使用此功能的方法,请在评论部分与社区共享。
注:这绝不是财务建议。你必须进行研究,并想出一种方法将此指标应用到你的交易风格和策略中。
顺便说一句,从现在起,我以后发布的任何脚本都将使用“大脑”这个名称。
回测测试

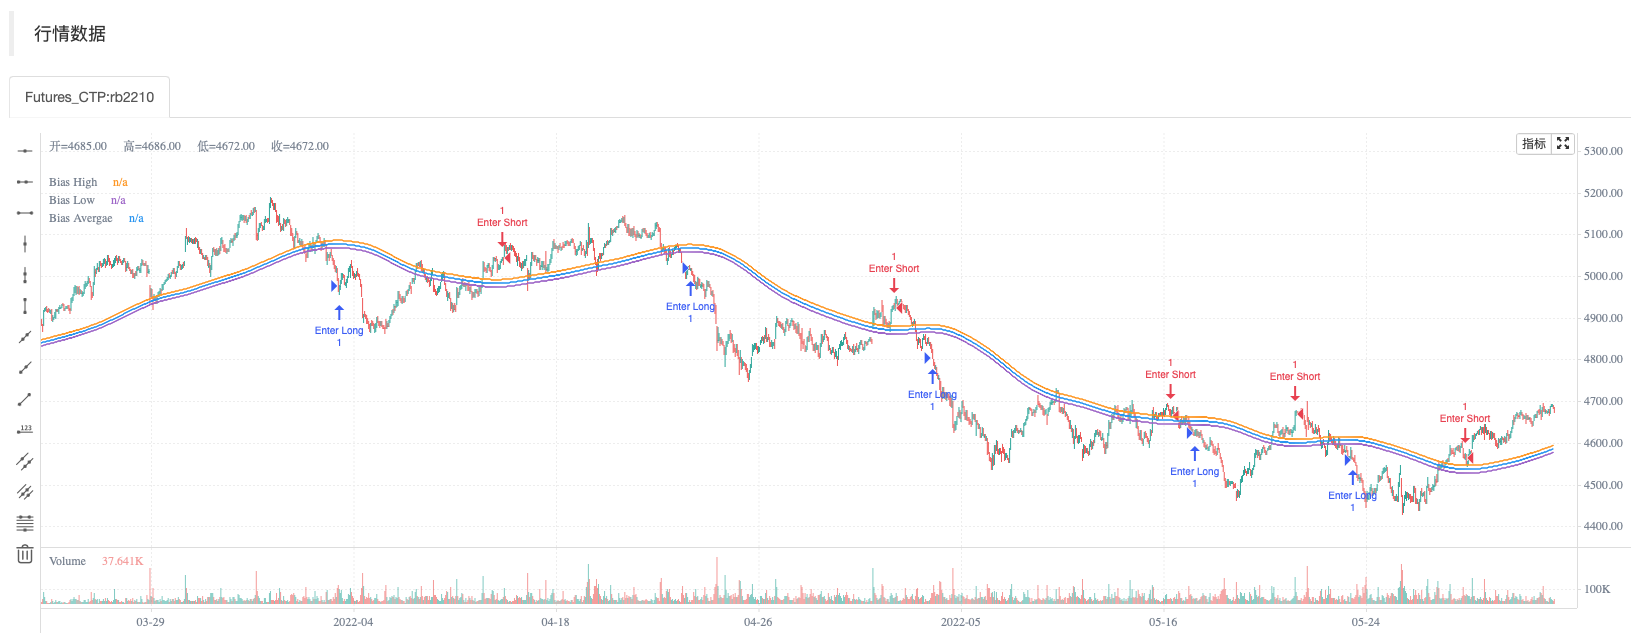
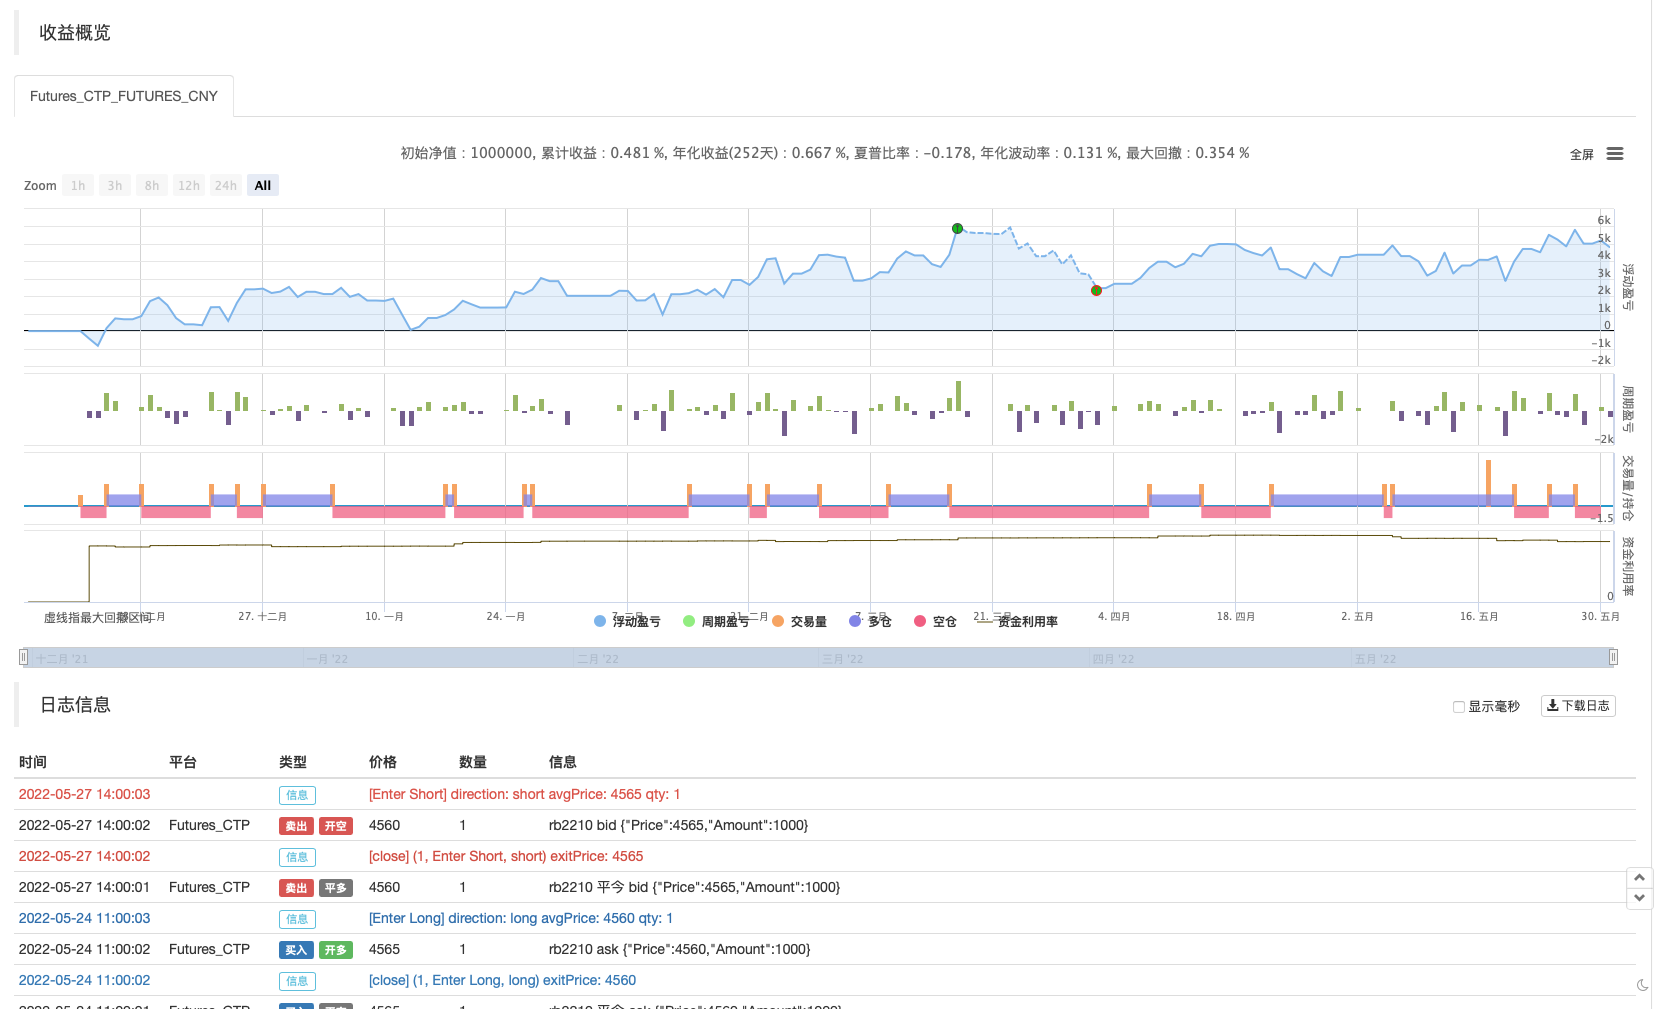
/*backtest
start: 2021-12-01 00:00:00
end: 2022-05-31 23:59:00
period: 10m
basePeriod: 1m
exchanges: [{"eid":"Futures_CTP","currency":"FUTURES"}]
args: [["ContractType","rb2210",360008]]
*/

// This source code is subject to the terms of the Mozilla Public License 2.0 at https://mozilla.org/MPL/2.0/
// © Professeur_X

//@version=5

indicator(title='HA Market Bias', shorttitle='HA Market Bias', overlay=true)

tf(_res, _exp, gaps_on) =>
    gaps_on == 0 ? request.security(syminfo.tickerid, _res, _exp) : gaps_on == true ? request.security(syminfo.tickerid, _res, _exp, barmerge.gaps_on, barmerge.lookahead_off) : request.security(syminfo.tickerid, _res, _exp, barmerge.gaps_off, barmerge.lookahead_off)

ha_htf = ''
show_ha = input.bool(true, "显示 HA 画图/ 市场 偏差", group="HA Market Bias")
ha_len = input(100, '周期', group="HA Market Bias")
ha_len2 = input(100, '平滑', group="HA Market Bias")

// Calculations {
o = ta.ema(open, ha_len)
c = ta.ema(close, ha_len)
h = ta.ema(high, ha_len)
l = ta.ema(low, ha_len)

haclose = tf(ha_htf, (o + h + l + c) / 4, 0)
xhaopen = tf(ha_htf, (o + c) / 2, 0)
haopen = na(xhaopen[1]) ? (o + c) / 2 : (xhaopen[1] + haclose[1]) / 2
hahigh = math.max(h, math.max(haopen, haclose))
halow = math.min(l, math.min(haopen, haclose))


o2 = tf(ha_htf, ta.ema(haopen, ha_len2), 0)
c2 = tf(ha_htf, ta.ema(haclose, ha_len2), 0)
h2 = tf(ha_htf, ta.ema(hahigh, ha_len2), 0)
l2 = tf(ha_htf, ta.ema(halow, ha_len2), 0)

ha_avg = (h2 + l2) / 2
// }

// Oscillator {
osc_len = input.int(7, "振荡器周期", group="HA Market Bias")

osc_bias = 100 *(c2 - o2)
osc_smooth = ta.ema(osc_bias, osc_len)

sigcolor =
  (osc_bias > 0) and (osc_bias >= osc_smooth) ? color.new(color.lime, 35) :
  (osc_bias > 0) and (osc_bias < osc_smooth) ? color.new(color.lime, 75) :
  (osc_bias < 0) and (osc_bias <= osc_smooth) ? color.new(color.red, 35) :
  (osc_bias < 0) and (osc_bias > osc_smooth) ? color.new(color.red, 75) :
  na
// }

// Plots {
p_h = plot(h2, "Bias High", display=display.none, editable=false)
p_l = plot(l2, "Bias Low", display=display.none, editable=false)
p_avg = plot(ha_avg, "Bias Avergae", display=display.none, editable=false)


col = o2 > c2 ? color.red : color.lime

if o2 > c2
    strategy.entry("Enter Long", strategy.long)
else if o2 < c2
    strategy.entry("Enter Short", strategy.short)
相关内容
- Williams%R-平滑策略
- Ichimoku云平滑振荡策略
- 倒锤策略(扩展选项)
- EMA日内云图策略
- Hull-4ema
- Ichimoku 云平滑振荡策略
- Heikin Ashi趋势
- 范围过滤器5分钟买卖策略
- 吕神简易波动率策略Pine语言版本
- 双重范围过滤器策略
更多内容
- EMA和ADX的三倍超趋势策略
- Tom DeMark连续热图策略
- QQE MOD + SSL Hybrid + Waddah Attar Explosion策略
- Ichimoku云平滑振荡策略
- 买/卖启动策略
- RSI MTF Ob+Os策略
- RSI-买卖信号策略
- MACD威利策略
- Ichimoku 云平滑振荡策略
- Heikin Ashi趋势
- C++ API调用例子
- TMA-Legacy策略
- Midas Mk.II-终极震荡策略
- Chande Kroll 止损
- CCI+EMA与RSI交叉策略
- 大鲷鱼警报R3.0+柴金波动条件+TP RSI
- 最佳TV策略
- EHMA范围策略
- 动量2.0策略
- Nik Stoch