RSI MTF Ob+Os策略
Author: 雨幕, Date: 2022-06-02 16:00:30Tags: RSI
你好,交易员们,
该指标与我之前的指标“CCI MTF Ob+Os”使用相同的概念。
这是一个简单的“相对强弱指数”(RSI)指标,具有多时间段(MTF)超买和超卖水平。
它可以在多达5个时间段内检测超买和超卖水平,这有助于交易员更容易地发现潜在的反转点。
可以选择1-5个时间段来检测超买和超卖。
湖绿色背景是“超卖”,寻找“多头”。 橙色背景为“超买”,寻找“空头”。
玩得开心:)
策略回测

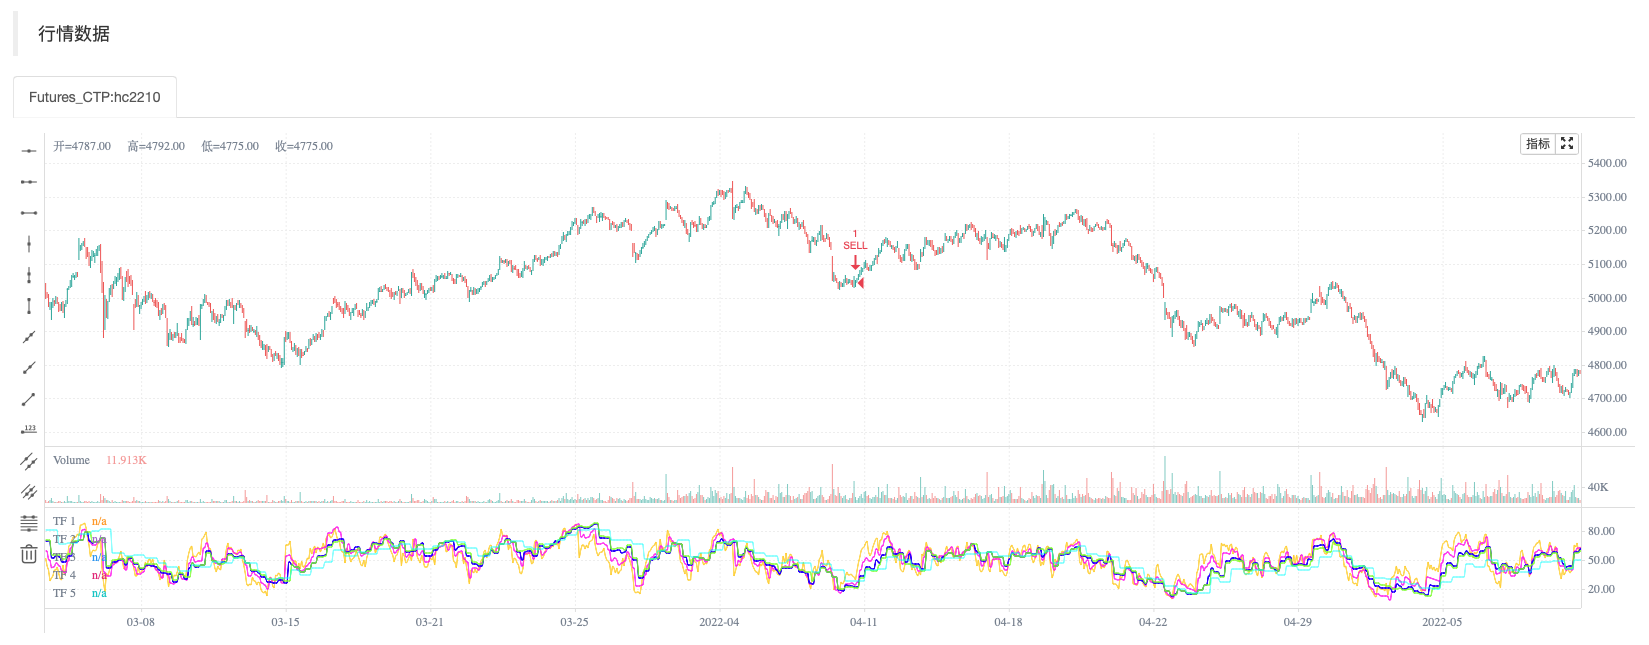
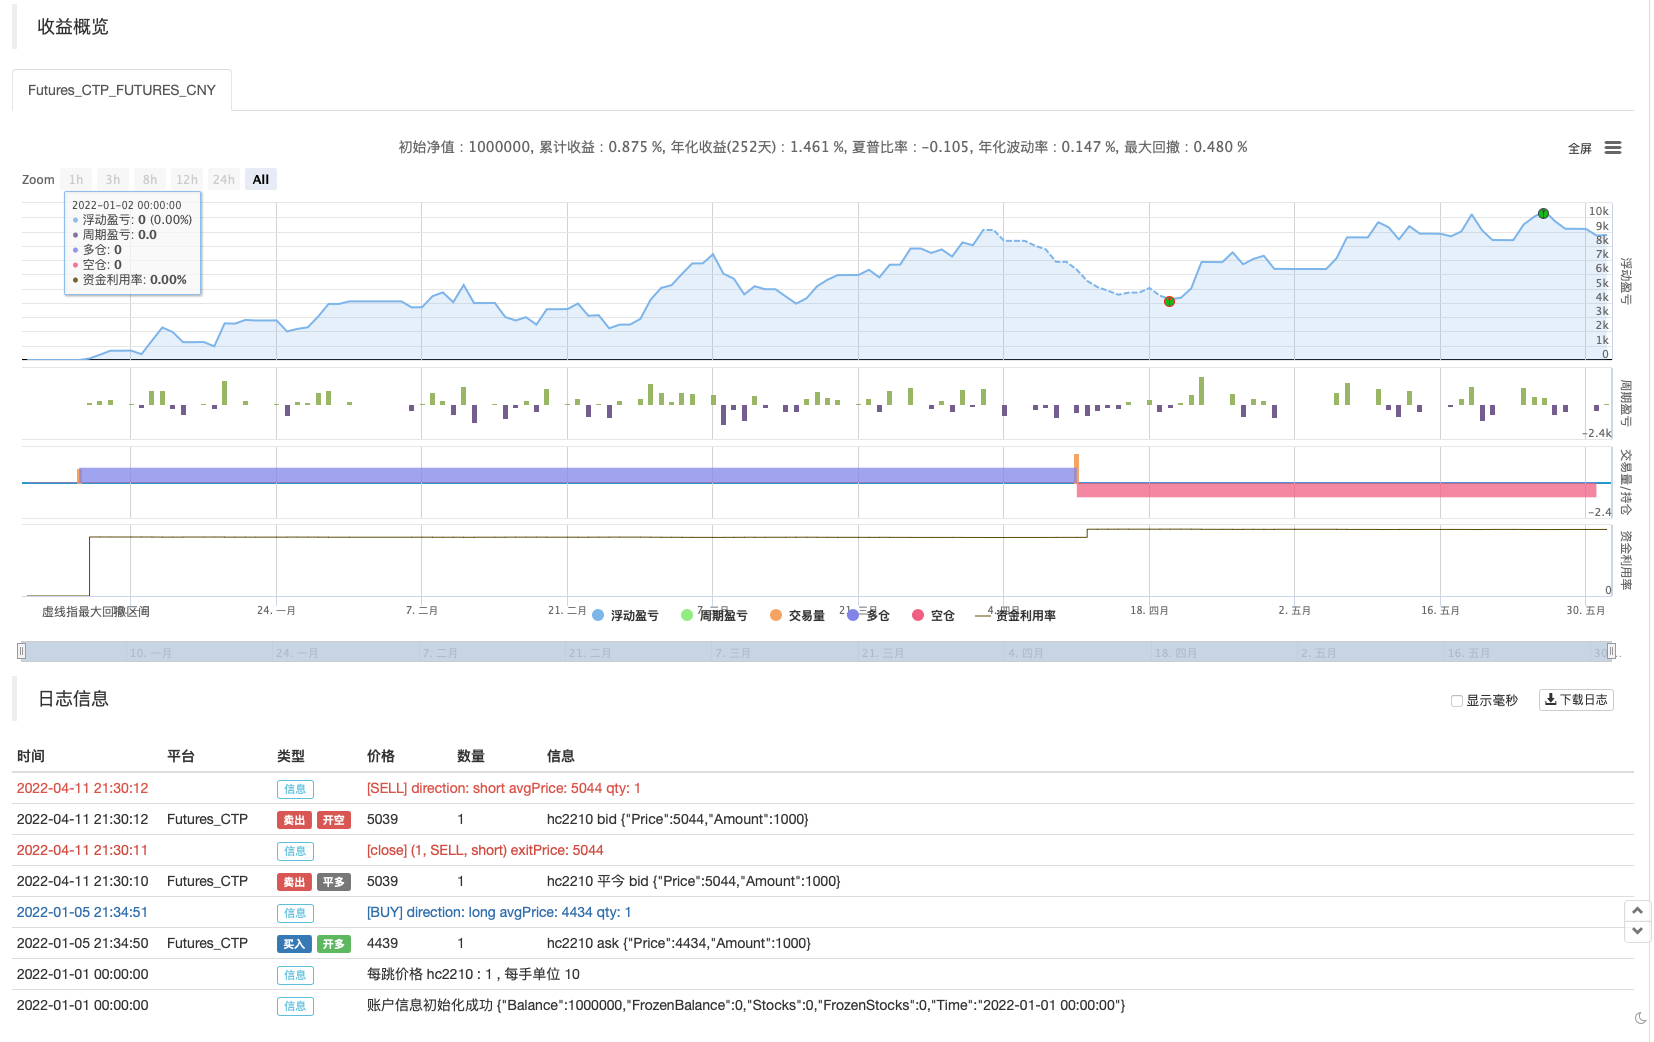
/*backtest
start: 2022-01-01 00:00:00
end: 2022-06-01 00:00:00
period: 15m
basePeriod: 5m
exchanges: [{"eid":"Futures_CTP","currency":"FUTURES"}]
args: [["v_input_int_1",9],["v_input_int_2",70],["v_input_int_3",30],["ContractType","hc2210",360008]]
*/

// This source code is subject to the terms of the Mozilla Public License 2.0 at https://mozilla.org/MPL/2.0/

// © thakon33

//    __  __        __             ____ ____

//   / /_/ /  ___ _/ /_____  ___  |_  /|_  /

//  / __/ _ \/ _ `/  '_/ _ \/ _ \_/_ <_/_ <

//  \__/_//_/\_,_/_/\_\\___/_//_/____/____/


//@version=5

indicator("RSI MTF Ob+Os")


//------------------------------------------------------------------------------

// Input

var g_rsi       = "[ RSI SETTING ]"

rsiSrc          = input    (title="数据源",     defval=close,                                group=g_rsi)

rsiLength       = input.int(title="周期",     defval=14,     minval=1,                     group=g_rsi)

rsiOverbought   = input.int(title="超买", defval=60,     minval=50, maxval=99, step=1, group=g_rsi)

rsiOversold     = input.int(title="超卖",   defval=40,     minval=1,  maxval=50, step=1, group=g_rsi)


var g_tf        = "[ SELECT TIMEFRAME ]"

rsiTf1          = input.timeframe(title="时间框架 1", defval="15",  group=g_tf, inline="tf1")

rsiTf2          = input.timeframe(title="时间框架 2", defval="30",  group=g_tf, inline="tf2")

rsiTf3          = input.timeframe(title="时间框架 3", defval="60",  group=g_tf, inline="tf3")

rsiTf4          = input.timeframe(title="时间框架 4", defval="120", group=g_tf, inline="tf4")

rsiTf5          = input.timeframe(title="时间框架 5", defval="240", group=g_tf, inline="tf5")

rsiTf1_E        = input.bool(title="是否使用 时间框架1", defval=true, group=g_tf, inline="tf1")

rsiTf2_E        = input.bool(title="是否使用 时间框架2", defval=true, group=g_tf, inline="tf2")

rsiTf3_E        = input.bool(title="是否使用 时间框架3", defval=true, group=g_tf, inline="tf3")

rsiTf4_E        = input.bool(title="是否使用 时间框架4", defval=true, group=g_tf, inline="tf4")

rsiTf5_E        = input.bool(title="是否使用 时间框架5", defval=true, group=g_tf, inline="tf5")


//------------------------------------------------------------------------------

// Calculate RSI


Fsec(Sym, Tf, Exp) =>

    request.security(Sym, Tf, Exp[barstate.isrealtime ? 1 : 0], barmerge.gaps_off, barmerge.lookahead_off) [barstate.isrealtime ? 0 : 1]


rsi1            = Fsec(syminfo.tickerid, rsiTf1, ta.rsi(rsiSrc, rsiLength))

rsi2            = Fsec(syminfo.tickerid, rsiTf2, ta.rsi(rsiSrc, rsiLength))

rsi3            = Fsec(syminfo.tickerid, rsiTf3, ta.rsi(rsiSrc, rsiLength))

rsi4            = Fsec(syminfo.tickerid, rsiTf4, ta.rsi(rsiSrc, rsiLength))

rsi5            = Fsec(syminfo.tickerid, rsiTf5, ta.rsi(rsiSrc, rsiLength))


//------------------------------------------------------------------------------

// RSI Overbought and Oversold detect


rsi1_Ob         = not rsiTf1_E or rsi1 >= rsiOverbought

rsi2_Ob         = not rsiTf2_E or rsi2 >= rsiOverbought

rsi3_Ob         = not rsiTf3_E or rsi3 >= rsiOverbought

rsi4_Ob         = not rsiTf4_E or rsi4 >= rsiOverbought

rsi5_Ob         = not rsiTf5_E or rsi5 >= rsiOverbought


rsi1_Os         = not rsiTf1_E or rsi1 <= rsiOversold

rsi2_Os         = not rsiTf2_E or rsi2 <= rsiOversold

rsi3_Os         = not rsiTf3_E or rsi3 <= rsiOversold

rsi4_Os         = not rsiTf4_E or rsi4 <= rsiOversold

rsi5_Os         = not rsiTf5_E or rsi5 <= rsiOversold


rsiOb           = rsi1_Ob and rsi2_Ob and rsi3_Ob and rsi4_Ob and rsi5_Ob

rsiOs           = rsi1_Os and rsi2_Os and rsi3_Os and rsi4_Os and rsi5_Os


//------------------------------------------------------------------------------

// Drawing on chart

plot    (rsiTf1_E ? rsi1 : na, title="TF 1",            color=color.rgb(255, 205, 22, 20),                                linewidth=1)

plot    (rsiTf2_E ? rsi2 : na, title="TF 2",            color=color.rgb(255, 22, 239, 20),                                linewidth=1)

plot    (rsiTf3_E ? rsi3 : na, title="TF 3",            color=color.rgb(38, 22, 255, 0),                                  linewidth=1)

plot    (rsiTf4_E ? rsi4 : na, title="TF 4",            color=color.rgb(123, 253, 22, 20),                                linewidth=1)

plot    (rsiTf5_E ? rsi5 : na, title="TF 5",            color=color.rgb(0, 255, 255, 50),                               linewidth=1)


strategy.entry("BUY", strategy.long, when=rsiOb)
strategy.entry("SELL", strategy.short, when=rsiOs)


//==============================================================================

//==============================================================================
相关内容
- RSI-买卖信号策略
- TMA-Legacy策略
- CCI+EMA与RSI交叉策略
- 大鲷鱼警报R3.0+柴金波动条件+TP RSI
- 最佳TV策略
- MTF RSI&STOCH策略
- BB-RSI-ADX指标入场点策略
- RSI和BBand同时超卖
- RSI枢轴点背离策略
- zdmre的RSI策略
更多内容
- K的反转指示器I
- baguette by multigrain 策略
- 吕神简易波动率策略Pine语言版本
- 3EMA + Boullinger + PIVOT 策略
- Williams%R-平滑策略
- EMA和ADX的三倍超趋势策略
- Tom DeMark连续热图策略
- QQE MOD + SSL Hybrid + Waddah Attar Explosion策略
- Ichimoku云平滑振荡策略
- 买/卖启动策略
- RSI-买卖信号策略
- MACD威利策略
- Ichimoku 云平滑振荡策略
- Heikin Ashi趋势
- HA市场偏差
- C++ API调用例子
- TMA-Legacy策略
- Midas Mk.II-终极震荡策略
- Chande Kroll 止损
- CCI+EMA与RSI交叉策略