Tom DeMark连续热图策略
Author: 雨幕(youquant), Date: 2022-06-06 11:30:10Tags: TD
该指示器使用Tom DeMark从1到13的TD顺序计数。 数字9和13通常识别一个耗尽的趋势,并标记一个趋势反转。 重要数字显示为标签(7-13),其中9和13均突出显示为“多”或“空”。
除数字外,价格蜡烛还根据顺序上色。 看涨的颜色从亮黄色(TD 1=趋势开始)到深红色(TD 13=趋势耗尽) 熊市的颜色从亮蓝色(TD 1=趋势开始)到深蓝色(TD 13=趋势耗尽)
DeMark建议仅用于短期价格反转,但如图所示,它也适用于LUNA 1D图表。 也可以很好地与Heikin Ashi蜡烛配合使用。
例如,将其与“Tom DeMark压力比”结合使用,以找到顶部和底部。 您可以更改时间范围,禁用标签/条形图颜色,并根据自己的喜好自定义颜色。
如果您对如何优化代码有任何想法,请随时分享
回测测试
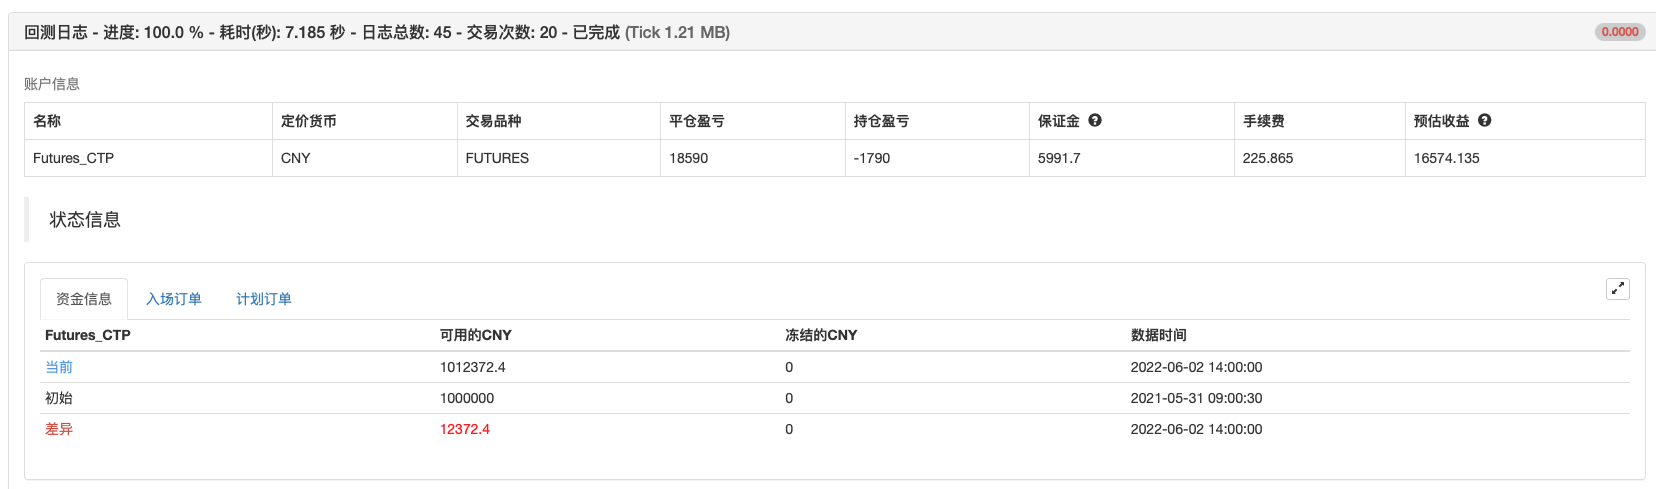
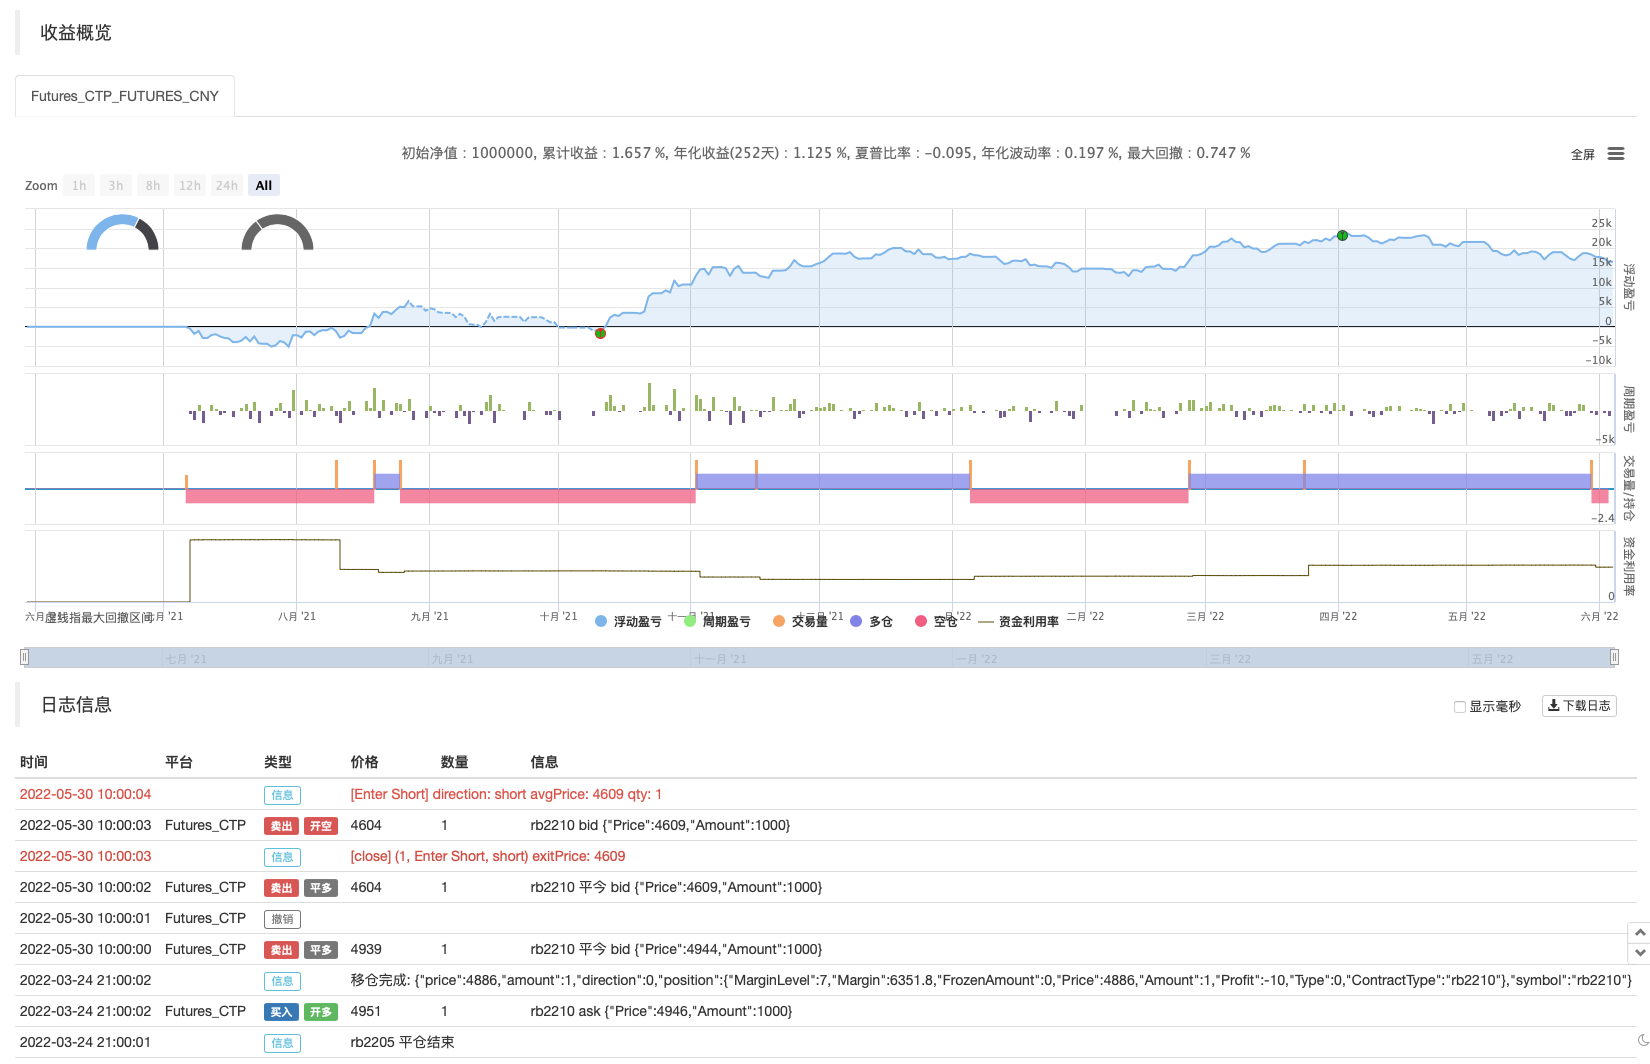
/*backtest
start: 2021-05-30 09:00:00
end: 2022-06-05 15:00:00
period: 1h
basePeriod: 15m
exchanges: [{"eid":"Futures_CTP","currency":"FUTURES"}]
args: [["ContractType","rb888",360008]]
*/
////////////////////////////////////////// Tom DeMark heatmap © by Indicator-Jones /////////////////////////////////////////
//
// This indicator uses Tom DeMark’s TD Sequential counting from 1 to 13.
// Number 9 and 13 usually identify an exhausted trend and mark trend reversal.
// The important numbers get displayed as labels (7-13), where 9 and 13 are both highlighted as "Long" or "Short".
// Besides the numbers the price candles are colored based upon the sequence.
// Bullish colors are starting from bright yellow (TD 1 = start of trend) to dark red (TD 13 = trend exhausted)
// Bearish colors are starting from bright blue (TD 1 = start of trend) to dark blue (TD 13 = trend exhausted)
//
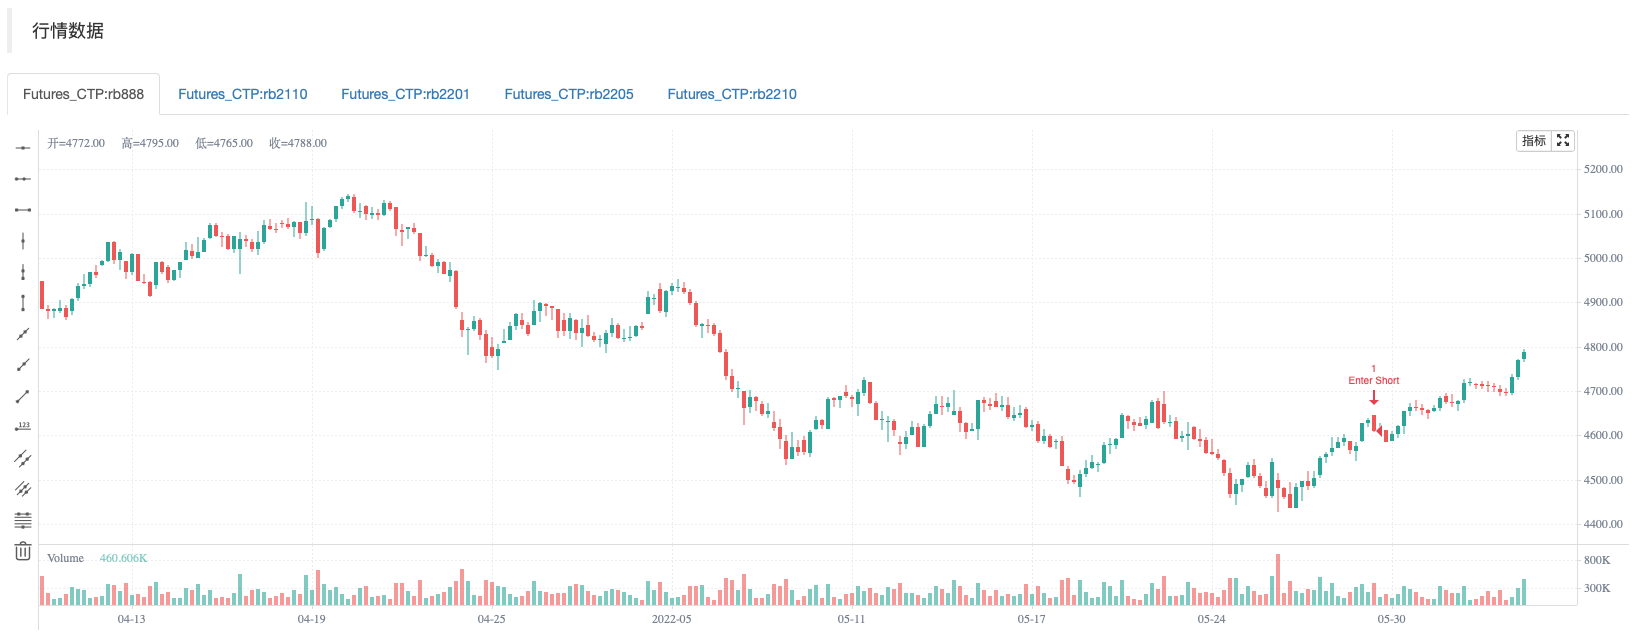
// DeMark recommends to be used for short term price reversals only but as you can see in the chart, it also works for LUNA 1D chart.
// Also works very well with Heikin Ashi candles.
// Use it in combination with for example the "Tom DeMark Pressure Ratio" to find tops and bottoms.
// You can change the timeframes, disable lables/barcolor and customise colors to your liking.
//
// If you have any idea on how to optimise the code, please feel free to share :)
//
// Inspired by "Stochastic Heat Map" from @Violent
//
////////////////////////////////////////////////////////////////////////////////////////////////////////////////////////////
//@version=5
indicator(title='Tom DeMark Sequential Heat Map', shorttitle='TD heatmap', overlay=true, timeframe='')
//A heat map for TD counts. If you find this useful or yank the code, please consider a donation :)
// -------- Inputs --------
paintBars = input(title='设置Bars颜色', defval=true)
showLabels = input(title='显示标签', defval=true)
buy_col = input(#32CD32,0,title='buy颜色',inline='col')
sell_col = input(#F44336,0,title='sell颜色',inline='col')
text_col = input(#FFFFFF,0,title='文本颜色',inline='col')
// -------- Bearish trend (blue) color selection --------
getBuyColor(count) =>
if count == 1
color.new(#11e7f2,0)
else
if count == 2
color.new(#11d9f2,0)
else
if count == 3
color.new(#11cbf2,0)
else
if count == 4
color.new(#11aff2,0)
else
if count == 5
color.new(#1193f2,0)
else
if count == 6
color.new(#1176f2,0)
else
if count == 7
color.new(#105df4,0)
else
if count == 8
color.new(#1051f5,0)
else
if count == 9
color.new(#0f44f5,0)
else
if count == 10
color.new(#0c3de0,0)
else
if count == 11
color.new(#0935ca,0)
else
if count == 12
color.new(#062eb4,0)
else
if count == 13
color.new(#02269e,0)
// -------- Bullish trend (blue) color selection --------
getSellColor(count) =>
if count == 1
color.new(#eef211,0)
else
if count == 2
color.new(#efdc11,0)
else
if count == 3
color.new(#f0c511,0)
else
if count == 4
color.new(#f1af11,0)
else
if count == 5
color.new(#f29811,0)
else
if count == 6
color.new(#f28811,0)
else
if count == 7
color.new(#f27811,0)
else
if count == 8
color.new(#f26811,0)
else
if count == 9
color.new(#f25811,0)
else
if count == 10
color.new(#ea420d,0)
else
if count == 11
color.new(#e12c09,0)
else
if count == 12
color.new(#d81605,0)
else
if count == 13
color.new(#cf0000,0)
// -------- Calculate bearish trend sequence --------
buySetup = 0
buySetup := close < close[4] ? buySetup[1] == 13 ? 1 : buySetup[1] + 1 : 0
// -------- Calculate bullish trend sequence --------
sellSetup = 0
sellSetup := close > close[4] ? sellSetup[1] == 13 ? 1 : sellSetup[1] + 1 : 0
// -------- Paint bars --------
barColour = buySetup >= 1 ? getBuyColor(buySetup) : sellSetup >= 1 ? getSellColor(sellSetup) : na
//barcolor(paintBars ? barColour : na, title='Bar colors (heatmap)')
if buySetup == 13
strategy.entry("Enter Long", strategy.long)
else if sellSetup == 13
strategy.entry("Enter Short", strategy.short)
相关内容
更多内容
- 倒锤策略(扩展选项)
- 标记反转点策略
- 砖型计数策略
- 带信号的Z分数策略
- K的反转指示器I
- baguette by multigrain 策略
- 吕神简易波动率策略Pine语言版本
- 3EMA + Boullinger + PIVOT 策略
- Williams%R-平滑策略
- EMA和ADX的三倍超趋势策略
- QQE MOD + SSL Hybrid + Waddah Attar Explosion策略
- Ichimoku云平滑振荡策略
- 买/卖启动策略
- RSI MTF Ob+Os策略
- RSI-买卖信号策略
- MACD威利策略
- Ichimoku 云平滑振荡策略
- Heikin Ashi趋势
- HA市场偏差
- C++ API调用例子