吊灯出场
Author: 雨幕(youquant), Date: 2022-05-23 09:14:47Tags: ATR
这是对吊灯出场指示信号的重新设计。它删除了吊灯出场状态之间的过渡,并且高亮显示了两条线的初始点。
该指标最初由Charles Le Beau开发,并由亚历山大·埃尔德(AlexanderElder)博士在其著作《走进我的交易室:交易的完整指南》(2002)中写道。
简而言之,这是基于平均真实范围(ATR)的后续止损。
回测测试
/*backtest
start: 2022-01-01 09:00:00
end: 2022-05-22 15:00:00
period: 1h
basePeriod: 15m
exchanges: [{"eid":"Futures_CTP","currency":"FUTURES"}]
args: [["v_input_1",12],["v_input_2",2],["ContractType","rb888",360008]]
*/
//@version=4
// Copyright (c) 2019-present, Alex Orekhov (everget)
// Chandelier Exit script may be freely distributed under the terms of the GPL-3.0 license.
study("Chandelier Exit", shorttitle="CE", overlay=true)
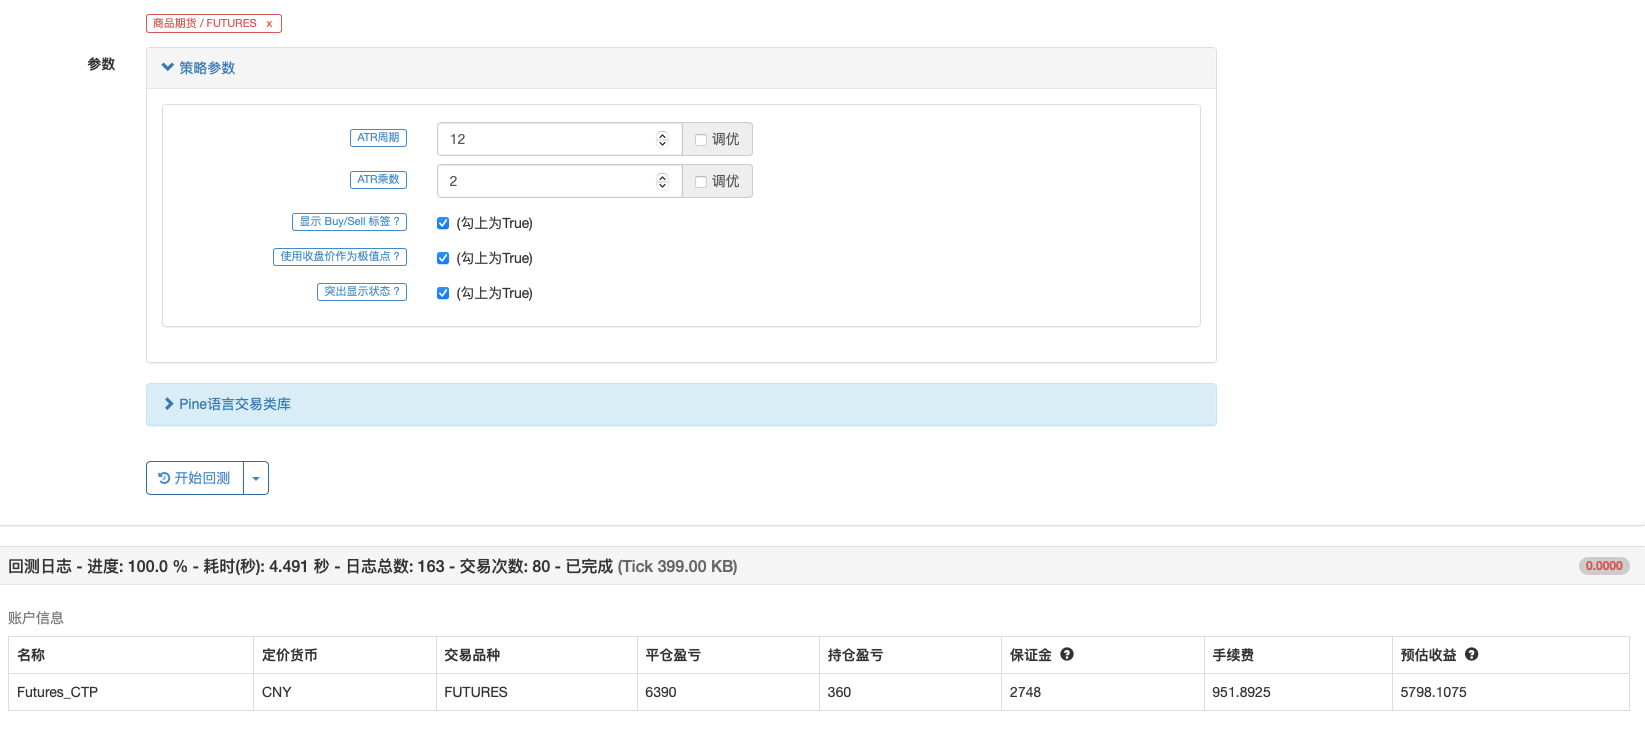
length = input(title="ATR周期", type=input.integer, defval=22)
mult = input(title="ATR乘数", type=input.float, step=0.1, defval=3.0)
showLabels = input(title="显示 Buy/Sell 标签 ?", type=input.bool, defval=true)
useClose = input(title="使用收盘价作为极值点 ?", type=input.bool, defval=true)
highlightState = input(title="突出显示状态 ?", type=input.bool, defval=true)
atr = mult * atr(length)
longStop = (useClose ? highest(close, length) : highest(length)) - atr
longStopPrev = nz(longStop[1], longStop)
longStop := close[1] > longStopPrev ? max(longStop, longStopPrev) : longStop
shortStop = (useClose ? lowest(close, length) : lowest(length)) + atr
shortStopPrev = nz(shortStop[1], shortStop)
shortStop := close[1] < shortStopPrev ? min(shortStop, shortStopPrev) : shortStop
var int dir = 1
dir := close > shortStopPrev ? 1 : close < longStopPrev ? -1 : dir
var color longColor = color.green
var color shortColor = color.red
longStopPlot = plot(dir == 1 ? longStop : na, title="Long Stop", style=plot.style_linebr, linewidth=2, color=longColor)
buySignal = dir == 1 and dir[1] == -1
plotshape(buySignal ? longStop : na, title="Long Stop Start", location=location.absolute, style=shape.circle, size=size.tiny, color=longColor, transp=0)
plotshape(buySignal and showLabels ? longStop : na, title="Buy Label", text="Buy", location=location.absolute, style=shape.labelup, size=size.tiny, color=longColor, textcolor=color.white, transp=0)
shortStopPlot = plot(dir == 1 ? na : shortStop, title="Short Stop", style=plot.style_linebr, linewidth=2, color=shortColor)
sellSignal = dir == -1 and dir[1] == 1
plotshape(sellSignal ? shortStop : na, title="Short Stop Start", location=location.absolute, style=shape.circle, size=size.tiny, color=shortColor, transp=0)
plotshape(sellSignal and showLabels ? shortStop : na, title="Sell Label", text="Sell", location=location.absolute, style=shape.labeldown, size=size.tiny, color=shortColor, textcolor=color.white, transp=0)
midPricePlot = plot(ohlc4, title="", style=plot.style_circles, linewidth=0, display=display.none, editable=false)
longFillColor = highlightState ? (dir == 1 ? longColor : na) : na
shortFillColor = highlightState ? (dir == -1 ? shortColor : na) : na
fill(midPricePlot, longStopPlot, title="Long State Filling", color=longFillColor)
fill(midPricePlot, shortStopPlot, title="Short State Filling", color=shortFillColor)
changeCond = dir != dir[1]
alertcondition(changeCond, title="Alert: CE Direction Change", message="Chandelier Exit has changed direction!")
alertcondition(buySignal, title="Alert: CE Buy", message="Chandelier Exit Buy!")
alertcondition(sellSignal, title="Alert: CE Sell", message="Chandelier Exit Sell!")
if buySignal
strategy.entry("Enter Long", strategy.long)
else if sellSignal
strategy.entry("Enter Short", strategy.short)
相关内容
更多内容