VuManChu密码B + 差异策略
Author: 雨幕(youquant), Date: 2022-05-23 11:29:16Tags: EMARSI
使用Vumanish密码B和发散进行回溯测试的策略。
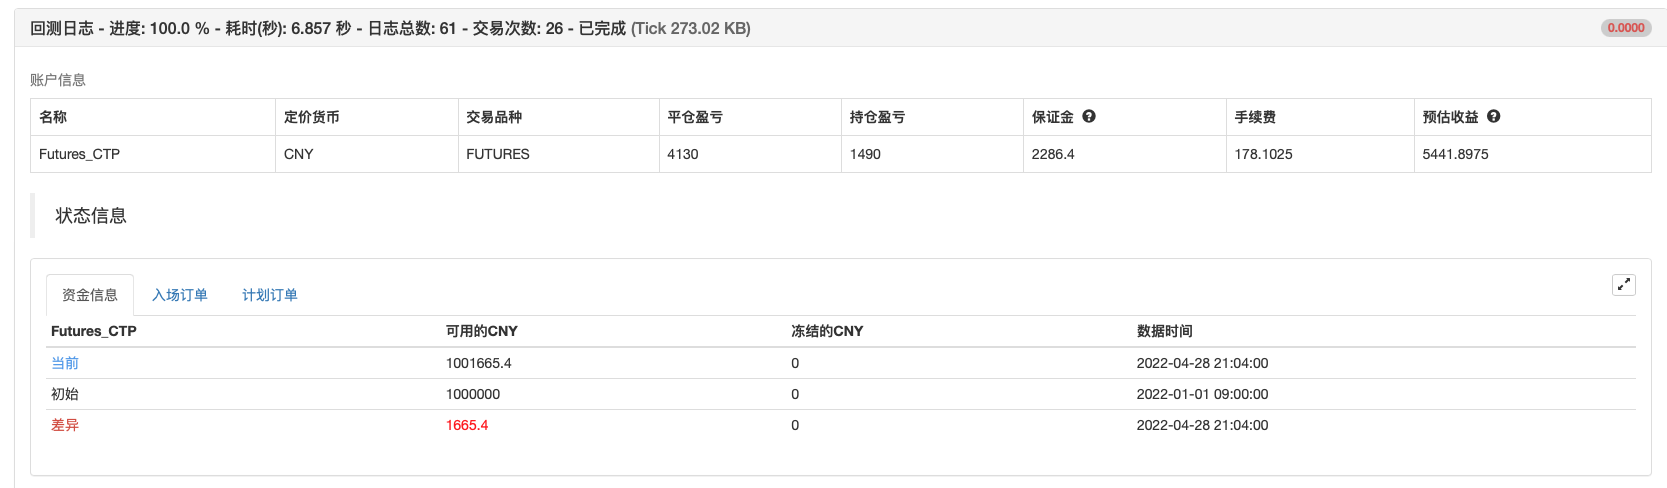
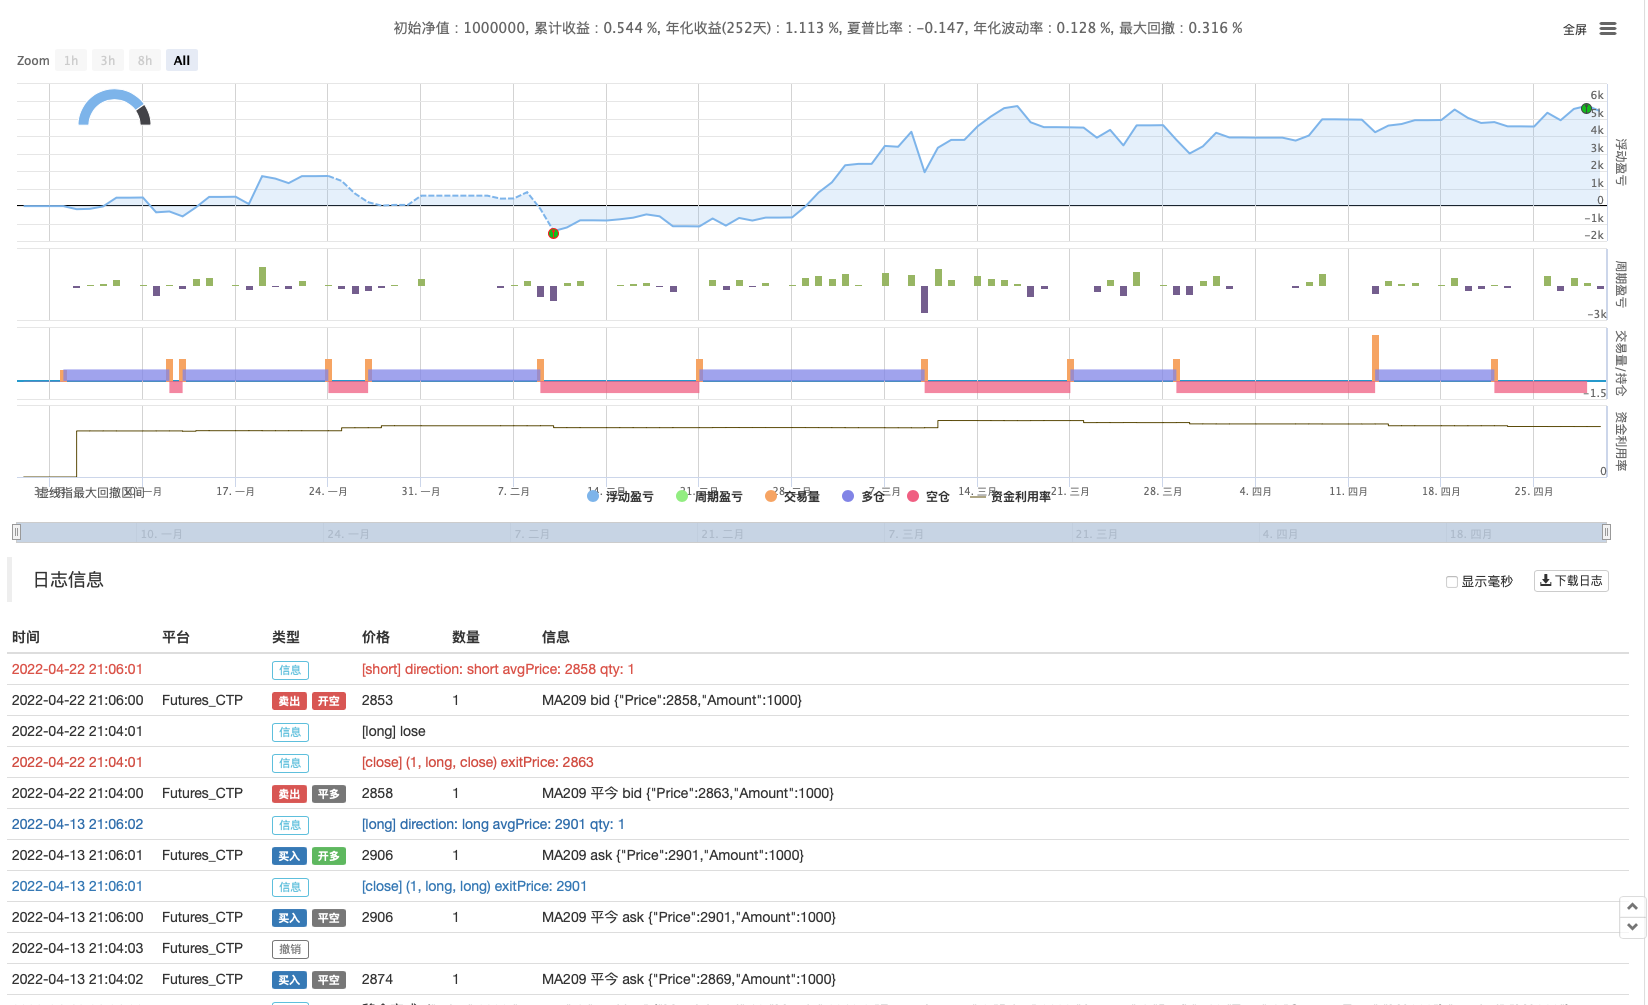
回测测试
// This source code is subject to the terms of the Mozilla Public License 2.0 at https://mozilla.org/MPL/2.0/
// © vumanchu

//@version=4


//  Thanks to dynausmaux for the code
//  Thanks to falconCoin for https://www.tradingview.com/script/KVfgBvDd-Market-Cipher-B-Free-version-with-Buy-and-sell/ inspired me to start this.
//  Thanks to LazyBear for WaveTrend Oscillator https://www.tradingview.com/script/2KE8wTuF-Indicator-WaveTrend-Oscillator-WT/
//  Thanks to RicardoSantos for https://www.tradingview.com/script/3oeDh0Yq-RS-Price-Divergence-Detector-V2/
//  Thanks to LucemAnb for Plain Stochastic Divergence https://www.tradingview.com/script/FCUgF8ag-Plain-Stochastic-Divergence/
//  Thanks to andreholanda73 for MFI+RSI Area https://www.tradingview.com/script/UlGZzUAr/
//  I especially want to thank TradingView for its platform that facilitates development and learning.

//
//  CIRCLES & TRIANGLES:
//    - LITTLE CIRCLE: They appear at all WaveTrend wave crossings.
//    - GREEN CIRCLE: The wavetrend waves are at the oversold level and have crossed up (bullish).
//    - RED CIRCLE: The wavetrend waves are at the overbought level and have crossed down (bearish).
//    - GOLD/ORANGE CIRCLE: When RSI is below 20, WaveTrend waves are below or equal to -80 and have crossed up after good bullish divergence (DONT BUY WHEN GOLD CIRCLE APPEAR).
//    - None of these circles are certain signs to trade. It is only information that can help you.
//    - PURPLE TRIANGLE: Appear when a bullish or bearish divergence is formed and WaveTrend waves crosses at overbought and oversold points.
//
//  NOTES:
//    - I am not an expert trader or know how to program pine script as such, in fact it is my first indicator only to study and all the code is copied and modified from other codes that are published in TradingView.
//    - I am very grateful to the entire TV community that publishes codes so that other newbies like me can learn and present their results. This is an attempt to imitate Market Cipher B.
//    - Settings by default are for 4h timeframe, divergences are more stronger and accurate. Haven't tested in all timeframes, only 2h and 4h.
//    - If you get an interesting result in other timeframes I would be very grateful if you would comment your configuration to implement it or at least check it.
//
//  CONTRIBUTIONS:
//    - Tip/Idea: Add higher timeframe analysis for bearish/bullish patterns at the current timeframe.
//    + Bearish/Bullish FLAG:
//      - MFI+RSI Area are RED (Below 0).
//      - Wavetrend waves are above 0 and crosses down.
//      - VWAP Area are below 0 on higher timeframe.
//      - This pattern reversed becomes bullish.
//    - Tip/Idea: Check the last heikinashi candle from 2 higher timeframe
//    + Bearish/Bullish DIAMOND:
//      - HT Candle is red
//      - WT > 0 and crossed down

// study(title = 'VuManChu B Divergences', shorttitle = 'VMC Cipher_B_Divergences')

// PARAMETERS {

// WaveTrend
wtShow = input(true, title = '显示波浪趋势', type = input.bool)
wtBuyShow = input(true, title = '显示买入点', type = input.bool)
wtGoldShow = input(true, title = '显示金叉点', type = input.bool)
wtSellShow = input(true, title = '显示卖出点', type = input.bool)
wtDivShow = input(true, title = '显示分区点', type = input.bool)
vwapShow = input(true, title = '显示快速WT', type = input.bool)
wtChannelLen = input(9, title = 'WT周期', type = input.integer)
wtAverageLen = input(12, title = 'WT平均长度', type = input.integer)
wtMASource = input(hlc3, title = 'WT平均数据取值', type = input.source)
wtMALen = input(3, title = 'WT平均周期', type = input.integer)

// WaveTrend Overbought & Oversold lines
obLevel = input(53, title = 'WT超买水平1', type = input.integer)
obLevel2 = input(60, title = 'WT超买水平2', type = input.integer)
obLevel3 = input(100, title = 'WT超买水平3', type = input.integer)
osLevel = input(-53, title = 'WT超卖水平1', type = input.integer)
osLevel2 = input(-60, title = 'WT超卖水平2', type = input.integer)
osLevel3 = input(-75, title = 'WT超卖水平3', type = input.integer)

// Divergence WT
wtShowDiv = input(true, title = '显示WT平均背离', type = input.bool)
wtShowHiddenDiv = input(false, title = '显示WT隐蔽背离', type = input.bool)
showHiddenDiv_nl = input(true, title = '不对隐藏的背离应用OB/OS限制', type = input.bool)
wtDivOBLevel = input(45, title = '最小WT熊市背离', type = input.integer)
wtDivOSLevel = input(-65, title = '最小WT牛市背离', type = input.integer)

// Divergence extra range
wtDivOBLevel_addshow = input(true, title = '显示第二WT平均背离', type = input.bool)
wtDivOBLevel_add = input(15, title = '第二WT熊市背离', type = input.integer)
wtDivOSLevel_add = input(-40, title = '第二WT牛市背离', type = input.integer)

// RSI+MFI
rsiMFIShow = input(true, title = '显示MFI', type = input.bool)
rsiMFIperiod = input(60,title = 'MFI周期', type = input.integer)
rsiMFIMultiplier = input(150, title = 'MFI区域乘数', type = input.float)
rsiMFIPosY = input(2.5, title = 'MFI区域Y位置', type = input.float)

// RSI
rsiShow = input(false, title = '显示RSI', type = input.bool)
rsiSRC = input(close, title = 'RSI计算的数据', type = input.source)
rsiLen = input(14, title = 'RSI周期', type = input.integer)
rsiOversold = input(30, title = 'RSI超卖', minval = 50, maxval = 100, type = input.integer)
rsiOverbought = input(60, title = 'RSI超买', minval = 0, maxval = 50, type = input.integer)

// Divergence RSI
rsiShowDiv = input(false, title = '显示RSI平均背离', type = input.bool)
rsiShowHiddenDiv = input(false, title = '显示RSI隐藏背离', type = input.bool)
rsiDivOBLevel = input(60, title = '最小RSI熊市背离', type = input.integer)
rsiDivOSLevel = input(30, title = '最小RSI牛市背离', type = input.integer)

// RSI Stochastic
stochShow = input(true, title = '显示Stochastic RSI', type = input.bool)
stochUseLog = input(true, title='使用日志?', type = input.bool)
stochAvg = input(false, title='K & D都平均', type = input.bool)
stochSRC = input(close, title = 'Stochastic RSI 数据源', type = input.source)
stochLen = input(14, title = 'Stochastic RSI 周期', type = input.integer)
stochRsiLen = input(14, title = 'RSI 周期 ', type = input.integer)
stochKSmooth = input(3, title = 'Stochastic RSI K 平滑', type = input.integer)
stochDSmooth = input(3, title = 'Stochastic RSI D 平滑', type = input.integer)

// Divergence stoch
stochShowDiv = input(false, title = '显示Stoch平均背离', type = input.bool)
stochShowHiddenDiv = input(false, title = '显示Stoch隐藏背离', type = input.bool)

// Schaff Trend Cycle
tcLine = input(false, title="显示Schaff TC线", type=input.bool)
tcSRC = input(close, title = 'Schaff TC 数据源', type = input.source)
tclength = input(10, title="Schaff TC周期", type=input.integer)
tcfastLength = input(23, title="Schaff TC 快线周期", type=input.integer)
tcslowLength = input(50, title="Schaff TC 慢线周期", type=input.integer)
tcfactor = input(0.5, title="Schaff TC 系数", type=input.float)

// Sommi Flag
sommiFlagShow = input(false, title = '显示Sommi标记', type = input.bool)
sommiShowVwap = input(false, title = '显示Sommi F. 波浪', type = input.bool)
sommiVwapTF = input('720', title = 'Sommi F. 波浪时间框架', type = input.string)
sommiVwapBearLevel = input(0, title = 'F. Wave 熊市等级 (少于)', type = input.integer)
sommiVwapBullLevel = input(0, title = 'F. Wave 牛市等级 (多于)', type = input.integer)
soomiFlagWTBearLevel = input(0, title = 'WT 熊市等级 (多于)', type = input.integer)
soomiFlagWTBullLevel = input(0, title = 'WT 牛市等级 (少于)', type = input.integer)
soomiRSIMFIBearLevel = input(0, title = '资金流熊市等级 (少于)', type = input.integer)
soomiRSIMFIBullLevel = input(0, title = '资金流牛市等级 (多于)', type = input.integer)

// Sommi Diamond
sommiDiamondShow = input(false, title = '显示 Sommi 钻石', type = input.bool)
sommiHTCRes = input('60', title = 'HTF 蜡烛图 Res. 1', type = input.string)
sommiHTCRes2 = input('240', title = 'HTF 蜡烛图 Res. 2', type = input.string)
soomiDiamondWTBearLevel = input(0, title = 'WT 熊市等级 (多于)', type = input.integer)
soomiDiamondWTBullLevel = input(0, title = 'WT 牛市等级 (少于)', type = input.integer)

// macd Colors
macdWTColorsShow = input(false, title = '显示 MACD 颜色', type = input.bool)
macdWTColorsTF = input('240', title = 'MACD 颜色 MACD TF', type = input.string)

darkMode = input(false, title = '暗色模式', type = input.bool)


// Colors
colorRed = #ff0000
colorPurple = #e600e6
colorGreen = #3fff00
colorOrange = #e2a400
colorYellow = #ffe500
colorWhite = #ffffff
colorPink = #ff00f0
colorBluelight = #31c0ff

colorWT1 = #90caf9
colorWT2 = #0d47a1

colorWT2_ = #131722

colormacdWT1a = #4caf58
colormacdWT1b = #af4c4c
colormacdWT1c = #7ee57e
colormacdWT1d = #ff3535

colormacdWT2a = #305630
colormacdWT2b = #310101
colormacdWT2c = #132213
colormacdWT2d = #770000

// } PARAMETERS


// FUNCTIONS {

// Divergences
f_top_fractal(src) => src[4] < src[2] and src[3] < src[2] and src[2] > src[1] and src[2] > src[0]
f_bot_fractal(src) => src[4] > src[2] and src[3] > src[2] and src[2] < src[1] and src[2] < src[0]
f_fractalize(src) => f_top_fractal(src) ? 1 : f_bot_fractal(src) ? -1 : 0

f_findDivs(src, topLimit, botLimit, useLimits) =>
    fractalTop = f_fractalize(src) > 0 and (useLimits ? src[2] >= topLimit : true) ? src[2] : na
    fractalBot = f_fractalize(src) < 0 and (useLimits ? src[2] <= botLimit : true) ? src[2] : na
    highPrev = valuewhen(fractalTop, src[2], 0)[2]
    highPrice = valuewhen(fractalTop, high[2], 0)[2]
    lowPrev = valuewhen(fractalBot, src[2], 0)[2]
    lowPrice = valuewhen(fractalBot, low[2], 0)[2]
    bearSignal = fractalTop and high[2] > highPrice and src[2] < highPrev
    bullSignal = fractalBot and low[2] < lowPrice and src[2] > lowPrev
    bearDivHidden = fractalTop and high[2] < highPrice and src[2] > highPrev
    bullDivHidden = fractalBot and low[2] > lowPrice and src[2] < lowPrev
    [fractalTop, fractalBot, lowPrev, bearSignal, bullSignal, bearDivHidden, bullDivHidden]

// RSI+MFI
f_rsimfi(_period, _multiplier, _tf) => security(syminfo.tickerid, _tf, sma(((close - open) / (high - low)) * _multiplier, _period) - rsiMFIPosY)

// WaveTrend
f_wavetrend(src, chlen, avg, malen, tf) =>
    tfsrc = security(syminfo.tickerid, tf, src)
    esa = ema(tfsrc, chlen)
    de = ema(abs(tfsrc - esa), chlen)
    ci = (tfsrc - esa) / (0.015 * de)
    wt1 = security(syminfo.tickerid, tf, ema(ci, avg))
    wt2 = security(syminfo.tickerid, tf, sma(wt1, malen))
    wtVwap = wt1 - wt2
    wtOversold = wt2 <= osLevel
    wtOverbought = wt2 >= obLevel
    wtCross = cross(wt1, wt2)
    wtCrossUp = wt2 - wt1 <= 0
    wtCrossDown = wt2 - wt1 >= 0
    wtCrosslast = cross(wt1[2], wt2[2])
    wtCrossUplast = wt2[2] - wt1[2] <= 0
    wtCrossDownlast = wt2[2] - wt1[2] >= 0
    [wt1, wt2, wtOversold, wtOverbought, wtCross, wtCrossUp, wtCrossDown, wtCrosslast, wtCrossUplast, wtCrossDownlast, wtVwap]

// Schaff Trend Cycle
f_tc(src, length, fastLength, slowLength) =>
    ema1 = ema(src, fastLength)
    ema2 = ema(src, slowLength)
    macdVal = ema1 - ema2
    alpha = lowest(macdVal, length)
    beta = highest(macdVal, length) - alpha
    gamma = (macdVal - alpha) / beta * 100
    gamma := beta > 0 ? gamma : nz(gamma[1])
    delta = gamma
    delta := na(delta[1]) ? delta : delta[1] + tcfactor * (gamma - delta[1])
    epsilon = lowest(delta, length)
    zeta = highest(delta, length) - epsilon
    eta = (delta - epsilon) / zeta * 100
    eta := zeta > 0 ? eta : nz(eta[1])
    stcReturn = eta
    stcReturn := na(stcReturn[1]) ? stcReturn : stcReturn[1] + tcfactor * (eta - stcReturn[1])
    stcReturn

// Stochastic RSI
f_stochrsi(_src, _stochlen, _rsilen, _smoothk, _smoothd, _log, _avg) =>
    src = _log ? log(_src) : _src
    rsi = rsi(src, _rsilen)
    kk = sma(stoch(rsi, rsi, rsi, _stochlen), _smoothk)
    d1 = sma(kk, _smoothd)
    avg_1 = avg(kk, d1)
    k = _avg ? avg_1 : kk
    [k, d1]

// MACD
f_macd(src, fastlen, slowlen, sigsmooth, tf) =>
    fast_ma = security(syminfo.tickerid, tf, ema(src, fastlen))
    slow_ma = security(syminfo.tickerid, tf, ema(src, slowlen))
    macd = fast_ma - slow_ma,
    signal = security(syminfo.tickerid, tf, sma(macd, sigsmooth))
    hist = macd - signal
    [macd, signal, hist]

// MACD Colors on WT
f_macdWTColors(tf) =>
    hrsimfi = f_rsimfi(rsiMFIperiod, rsiMFIMultiplier, tf)
    [macd, signal, hist] = f_macd(close, 28, 42, 9, macdWTColorsTF)
    macdup = macd >= signal
    macddown = macd <= signal
    macdWT1Color = macdup ? hrsimfi > 0 ? colormacdWT1c : colormacdWT1a : macddown ? hrsimfi < 0 ? colormacdWT1d : colormacdWT1b : na
    macdWT2Color = macdup ? hrsimfi < 0 ? colormacdWT2c : colormacdWT2a : macddown ? hrsimfi < 0 ? colormacdWT2d : colormacdWT2b : na
    [macdWT1Color, macdWT2Color]

// Get higher timeframe candle
f_getTFCandle(_tf) =>
    _open  = security(heikinashi(syminfo.tickerid), _tf, open, barmerge.gaps_off, barmerge.lookahead_on)
    _close = security(heikinashi(syminfo.tickerid), _tf, close, barmerge.gaps_off, barmerge.lookahead_on)
    _high  = security(heikinashi(syminfo.tickerid), _tf, high, barmerge.gaps_off, barmerge.lookahead_on)
    _low   = security(heikinashi(syminfo.tickerid), _tf, low, barmerge.gaps_off, barmerge.lookahead_on)
    hl2   = (_high + _low) / 2.0
    newBar = change(_open)
    candleBodyDir = _close > _open
    [candleBodyDir, newBar]

// Sommi flag
f_findSommiFlag(tf, wt1, wt2, rsimfi, wtCross, wtCrossUp, wtCrossDown) =>
    [hwt1, hwt2, hwtOversold, hwtOverbought, hwtCross, hwtCrossUp, hwtCrossDown, hwtCrosslast, hwtCrossUplast, hwtCrossDownlast, hwtVwap] = f_wavetrend(wtMASource, wtChannelLen, wtAverageLen, wtMALen, tf)

    bearPattern = rsimfi < soomiRSIMFIBearLevel and
                   wt2 > soomiFlagWTBearLevel and
                   wtCross and
                   wtCrossDown and
                   hwtVwap < sommiVwapBearLevel

    bullPattern = rsimfi > soomiRSIMFIBullLevel and
                   wt2 < soomiFlagWTBullLevel and
                   wtCross and
                   wtCrossUp and
                   hwtVwap > sommiVwapBullLevel

    [bearPattern, bullPattern, hwtVwap]

f_findSommiDiamond(tf, tf2, wt1, wt2, wtCross, wtCrossUp, wtCrossDown) =>
    [candleBodyDir, newBar] = f_getTFCandle(tf)
    [candleBodyDir2, newBar2] = f_getTFCandle(tf2)
    bearPattern = wt2 >= soomiDiamondWTBearLevel and
                   wtCross and
                   wtCrossDown and
                   not candleBodyDir and
                   not candleBodyDir2
    bullPattern = wt2 <= soomiDiamondWTBullLevel and
                   wtCross and
                   wtCrossUp and
                   candleBodyDir and
                   candleBodyDir2
    [bearPattern, bullPattern]

// } FUNCTIONS

// CALCULATE INDICATORS {

// RSI
rsi = rsi(rsiSRC, rsiLen)
rsiColor = rsi <= rsiOversold ? colorGreen : rsi >= rsiOverbought ? colorRed : colorPurple

// RSI + MFI Area
rsiMFI = f_rsimfi(rsiMFIperiod, rsiMFIMultiplier, timeframe.period)
rsiMFIColor = rsiMFI > 0 ? #3ee145 : #ff3d2e

// Calculates WaveTrend
[wt1, wt2, wtOversold, wtOverbought, wtCross, wtCrossUp, wtCrossDown, wtCross_last, wtCrossUp_last, wtCrossDown_last, wtVwap] = f_wavetrend(wtMASource, wtChannelLen, wtAverageLen, wtMALen, timeframe.period)

// Stochastic RSI
[stochK, stochD] = f_stochrsi(stochSRC, stochLen, stochRsiLen, stochKSmooth, stochDSmooth, stochUseLog, stochAvg)

// Schaff Trend Cycle
tcVal = f_tc(tcSRC, tclength, tcfastLength, tcslowLength)

// Sommi flag
[sommiBearish, sommiBullish, hvwap] = f_findSommiFlag(sommiVwapTF, wt1, wt2, rsiMFI, wtCross,  wtCrossUp, wtCrossDown)

//Sommi diamond
[sommiBearishDiamond, sommiBullishDiamond] = f_findSommiDiamond(sommiHTCRes, sommiHTCRes2, wt1, wt2, wtCross, wtCrossUp, wtCrossDown)

// macd colors
[macdWT1Color, macdWT2Color] = f_macdWTColors(macdWTColorsTF)

// WT Divergences
[wtFractalTop, wtFractalBot, wtLow_prev, wtBearDiv, wtBullDiv, wtBearDivHidden, wtBullDivHidden] = f_findDivs(wt2, wtDivOBLevel, wtDivOSLevel, true)

[wtFractalTop_add, wtFractalBot_add, wtLow_prev_add, wtBearDiv_add, wtBullDiv_add, wtBearDivHidden_add, wtBullDivHidden_add] =  f_findDivs(wt2, wtDivOBLevel_add, wtDivOSLevel_add, true)
[wtFractalTop_nl, wtFractalBot_nl, wtLow_prev_nl, wtBearDiv_nl, wtBullDiv_nl, wtBearDivHidden_nl, wtBullDivHidden_nl] =  f_findDivs(wt2, 0, 0, false)

wtBearDivHidden_ = showHiddenDiv_nl ? wtBearDivHidden_nl : wtBearDivHidden
wtBullDivHidden_ = showHiddenDiv_nl ? wtBullDivHidden_nl : wtBullDivHidden

wtBearDivColor = (wtShowDiv and wtBearDiv) or (wtShowHiddenDiv and wtBearDivHidden_) ? colorRed : na
wtBullDivColor = (wtShowDiv and wtBullDiv) or (wtShowHiddenDiv and wtBullDivHidden_) ? colorGreen : na

wtBearDivColor_add = (wtShowDiv and (wtDivOBLevel_addshow and wtBearDiv_add)) or (wtShowHiddenDiv and (wtDivOBLevel_addshow and wtBearDivHidden_add)) ? #9a0202 : na
wtBullDivColor_add = (wtShowDiv and (wtDivOBLevel_addshow and wtBullDiv_add)) or (wtShowHiddenDiv and (wtDivOBLevel_addshow and wtBullDivHidden_add)) ? #1b5e20 : na

// RSI Divergences
[rsiFractalTop, rsiFractalBot, rsiLow_prev, rsiBearDiv, rsiBullDiv, rsiBearDivHidden, rsiBullDivHidden] = f_findDivs(rsi, rsiDivOBLevel, rsiDivOSLevel, true)
[rsiFractalTop_nl, rsiFractalBot_nl, rsiLow_prev_nl, rsiBearDiv_nl, rsiBullDiv_nl, rsiBearDivHidden_nl, rsiBullDivHidden_nl] = f_findDivs(rsi, 0, 0, false)

rsiBearDivHidden_ = showHiddenDiv_nl ? rsiBearDivHidden_nl : rsiBearDivHidden
rsiBullDivHidden_ = showHiddenDiv_nl ? rsiBullDivHidden_nl : rsiBullDivHidden

rsiBearDivColor = (rsiShowDiv and rsiBearDiv) or (rsiShowHiddenDiv and rsiBearDivHidden_) ? colorRed : na
rsiBullDivColor = (rsiShowDiv and rsiBullDiv) or (rsiShowHiddenDiv and rsiBullDivHidden_) ? colorGreen : na

// Stoch Divergences
[stochFractalTop, stochFractalBot, stochLow_prev, stochBearDiv, stochBullDiv, stochBearDivHidden, stochBullDivHidden] = f_findDivs(stochK, 0, 0, false)

stochBearDivColor = (stochShowDiv and stochBearDiv) or (stochShowHiddenDiv and stochBearDivHidden) ? colorRed : na
stochBullDivColor = (stochShowDiv and stochBullDiv) or (stochShowHiddenDiv and stochBullDivHidden) ? colorGreen : na


// Small Circles WT Cross
signalColor = wt2 - wt1 > 0 ? color.red : color.lime

// Buy signal.
buySignal = wtCross and wtCrossUp and wtOversold

buySignalDiv = (wtShowDiv and wtBullDiv) or
               (wtShowDiv and wtBullDiv_add) or
               (stochShowDiv and stochBullDiv) or
               (rsiShowDiv and rsiBullDiv)

buySignalDiv_color = wtBullDiv ? colorGreen :
                     wtBullDiv_add ? color.new(colorGreen, 60) :
                     rsiShowDiv ? colorGreen : na

// Sell signal
sellSignal = wtCross and wtCrossDown and wtOverbought

sellSignalDiv = (wtShowDiv and wtBearDiv) or
               (wtShowDiv and wtBearDiv_add) or
               (stochShowDiv and stochBearDiv) or
               (rsiShowDiv and rsiBearDiv)

sellSignalDiv_color = wtBearDiv ? colorRed :
                     wtBearDiv_add ? color.new(colorRed, 60) :
                     rsiBearDiv ? colorRed : na

// Gold Buy
lastRsi = valuewhen(wtFractalBot, rsi[2], 0)[2]
wtGoldBuy = ((wtShowDiv and wtBullDiv) or (rsiShowDiv and rsiBullDiv)) and
           wtLow_prev <= osLevel3 and
           wt2 > osLevel3 and
           wtLow_prev - wt2 <= -5 and
           lastRsi < 30

// } CALCULATE INDICATORS


// DRAW {
bgcolor(darkMode ? color.new(#000000, 80) : na)
zLine = plot(0, color = color.new(colorWhite, 50))

//  MFI BAR
rsiMfiBarTopLine = plot(rsiMFIShow ? -95 : na, title = 'MFI Bar TOP Line', transp = 100)
rsiMfiBarBottomLine = plot(rsiMFIShow ? -99 : na, title = 'MFI Bar BOTTOM Line', transp = 100)
fill(rsiMfiBarTopLine, rsiMfiBarBottomLine, title = 'MFI Bar Colors', color = rsiMFIColor, transp = 75)

// WT Areas
plot(wtShow ? wt1 : na, style = plot.style_area, title = 'WT Wave 1', color = macdWTColorsShow ? macdWT1Color : colorWT1, transp = 0)
plot(wtShow ? wt2 : na, style = plot.style_area, title = 'WT Wave 2', color = macdWTColorsShow ? macdWT2Color : darkMode ? colorWT2_ : colorWT2 , transp = 20)

// VWAP
plot(vwapShow ? wtVwap : na, title = 'VWAP', color = colorYellow, style = plot.style_area, linewidth = 2, transp = 45)

// MFI AREA
rsiMFIplot = plot(rsiMFIShow ? rsiMFI: na, title = 'RSI+MFI Area', color = rsiMFIColor, transp = 20)
fill(rsiMFIplot, zLine, rsiMFIColor, transp = 40)

// WT Div

plot(series = wtFractalTop ? wt2[2] : na, title = 'WT Bearish Divergence', color = wtBearDivColor, linewidth = 2, offset = -2)
plot(series = wtFractalBot ? wt2[2] : na, title = 'WT Bullish Divergence', color = wtBullDivColor, linewidth = 2, offset = -2)

// WT 2nd Div
plot(series = wtFractalTop_add ? wt2[2] : na, title = 'WT 2nd Bearish Divergence', color = wtBearDivColor_add, linewidth = 2, offset = -2)
plot(series = wtFractalBot_add ? wt2[2] : na, title = 'WT 2nd Bullish Divergence', color = wtBullDivColor_add, linewidth = 2, offset = -2)

// RSI
plot(rsiShow ? rsi : na, title = 'RSI', color = rsiColor, linewidth = 2, transp = 25)

// RSI Div
plot(series = rsiFractalTop ? rsi[2] : na, title='RSI Bearish Divergence', color = rsiBearDivColor, linewidth = 1, offset = -2)
plot(series = rsiFractalBot ? rsi[2] : na, title='RSI Bullish Divergence', color = rsiBullDivColor, linewidth = 1, offset = -2)

// Stochastic RSI
stochKplot = plot(stochShow ? stochK : na, title = 'Stoch K', color = color.new(#21baf3, 0), linewidth = 2)
stochDplot = plot(stochShow ? stochD : na, title = 'Stoch D', color = color.new(#673ab7, 60), linewidth = 1)
stochFillColor = stochK >= stochD ? color.new(#21baf3, 75) : color.new(#673ab7, 60)
fill(stochKplot, stochDplot, title='KD Fill', color=stochFillColor)

// Stoch Div
plot(series = stochFractalTop ? stochK[2] : na, title='Stoch Bearish Divergence', color = stochBearDivColor, linewidth = 1, offset = -2)
plot(series = stochFractalBot ? stochK[2] : na, title='Stoch Bullish Divergence', color = stochBullDivColor, linewidth = 1, offset = -2)

// Schaff Trend Cycle
plot(tcLine ? tcVal : na, color = color.new(#673ab7, 25), linewidth = 2, title = "Schaff Trend Cycle 1")
plot(tcLine ? tcVal : na, color = color.new(colorWhite, 50), linewidth = 1, title = "Schaff Trend Cycle 2")


// Draw Overbought & Oversold lines
//plot(obLevel, title = 'Over Bought Level 1', color = colorWhite, linewidth = 1, style = plot.style_circles, transp = 85)
plot(obLevel2, title = 'Over Bought Level 2', color = colorWhite, linewidth = 1, style = plot.style_stepline, transp = 85)
plot(obLevel3, title = 'Over Bought Level 3', color = colorWhite, linewidth = 1, style = plot.style_circles, transp = 95)

//plot(osLevel, title = 'Over Sold Level 1', color = colorWhite, linewidth = 1, style = plot.style_circles, transp = 85)
plot(osLevel2, title = 'Over Sold Level 2', color = colorWhite, linewidth = 1, style = plot.style_stepline, transp = 85)

// Sommi flag
plotchar(sommiFlagShow and sommiBearish ? 108 : na, title = 'Sommi bearish flag', char='⚑', color = colorPink, location = location.absolute, size = size.tiny, transp = 0)
plotchar(sommiFlagShow and sommiBullish ? -108 : na, title = 'Sommi bullish flag', char='⚑', color = colorBluelight, location = location.absolute, size = size.tiny, transp = 0)
plot(sommiShowVwap ? ema(hvwap, 3) : na, title = 'Sommi higher VWAP', color = colorYellow, linewidth = 2, style = plot.style_line, transp = 15)

// Sommi diamond
plotchar(sommiDiamondShow and sommiBearishDiamond ? 108 : na, title = 'Sommi bearish diamond', char='◆', color = colorPink, location = location.absolute, size = size.tiny, transp = 0)
plotchar(sommiDiamondShow and sommiBullishDiamond ? -108 : na, title = 'Sommi bullish diamond', char='◆', color = colorBluelight, location = location.absolute, size = size.tiny, transp = 0)

// Circles
plot(wtCross ? wt2 : na, title = 'Buy and sell circle', color = signalColor, style = plot.style_circles, linewidth = 3, transp = 15)

plotchar(wtBuyShow and buySignal ? -107 : na, title = 'Buy circle', char='·', color = colorGreen, location = location.absolute, size = size.small, transp = 50)
plotchar(wtSellShow and sellSignal ? 105 : na , title = 'Sell circle', char='·', color = colorRed, location = location.absolute, size = size.small, transp = 50)

plotchar(wtDivShow and buySignalDiv ? -106 : na, title = 'Divergence buy circle', char='•', color = buySignalDiv_color, location = location.absolute, size = size.small, offset = -2, transp = 15)
plotchar(wtDivShow and sellSignalDiv ? 106 : na, title = 'Divergence sell circle', char='•', color = sellSignalDiv_color, location = location.absolute, size = size.small, offset = -2, transp = 15)

plotchar(wtGoldBuy and wtGoldShow ? -106 : na, title = 'Gold  buy gold circle', char='•', color = colorOrange, location = location.absolute, size = size.small, offset = -2, transp = 15)

// } DRAW


len = input(14, title="长度")
th = input(20, title="TH")

TrueRange = max(max(high-low, abs(high-nz(close[1]))), abs(low-nz(close[1])))
DirectionalMovementPlus = high-nz(high[1]) > nz(low[1])-low ? max(high-nz(high[1]), 0): 0
DirectionalMovementMinus = nz(low[1])-low > high-nz(high[1]) ? max(nz(low[1])-low, 0): 0

SmoothedTrueRange = 0.0
SmoothedTrueRange := nz(SmoothedTrueRange[1]) - (nz(SmoothedTrueRange[1])/len) + TrueRange

SmoothedDirectionalMovementPlus = 0.0
SmoothedDirectionalMovementPlus := nz(SmoothedDirectionalMovementPlus[1]) - (nz(SmoothedDirectionalMovementPlus[1])/len) + DirectionalMovementPlus

SmoothedDirectionalMovementMinus = 0.0
SmoothedDirectionalMovementMinus := nz(SmoothedDirectionalMovementMinus[1]) - (nz(SmoothedDirectionalMovementMinus[1])/len) + DirectionalMovementMinus

DIPlus = SmoothedDirectionalMovementPlus / SmoothedTrueRange * 100
DIMinus = SmoothedDirectionalMovementMinus / SmoothedTrueRange * 100
DX = abs(DIPlus-DIMinus) / (DIPlus+DIMinus)*100
ADX = sma(DX, len)

plot(ADX, color=color.white, title="ADX")


// ALERTS {

// BUY
// alertcondition(buySignal, 'Buy (Big green circle)', 'Green circle WaveTrend Oversold')
// alertcondition(buySignalDiv, 'Buy (Big green circle + Div)', 'Buy & WT Bullish Divergence & WT Overbought')
// alertcondition(wtGoldBuy, 'GOLD Buy (Big GOLDEN circle)', 'Green & GOLD circle WaveTrend Overbought')
// alertcondition(sommiBullish or sommiBullishDiamond, 'Sommi bullish flag/diamond', 'Blue flag/diamond')
// alertcondition(wtCross and wtCrossUp, 'Buy (Small green dot)', 'Buy small circle')

// SELL
// alertcondition(sommiBearish or sommiBearishDiamond, 'Sommi bearish flag/diamond', 'Purple flag/diamond')
// alertcondition(sellSignal, 'Sell (Big red circle)', 'Red Circle WaveTrend Overbought')
// alertcondition(sellSignalDiv, 'Sell (Big red circle + Div)', 'Buy & WT Bearish Divergence & WT Overbought')
// alertcondition(wtCross and wtCrossDown, 'Sell (Small red dot)', 'Sell small circle')

// } ALERTS

f_RelVol(_value, _length) =>
    min_value = lowest(_value, _length)
    max_value = highest(_value, _length)
    stoch(_value, max_value, min_value, _length) / 100

rsi1LengthInput = input(100, minval=1, title="RSI 周期", group="RSI Settings")
rsi1SourceInput = input(close, "Source", group="RSI Settings")

rsi2LengthInput = input(25, minval=1, title="RSI 周期", group="RSI Settings")
rsi2SourceInput = input(close, "Source", title="数据源", group="RSI Settings")

price   = close
length  = input(10, title="周期", minval=1)
DER_avg = input(5, '平均', minval=1, inline='DER', group='Directional Energy Ratio')
smooth  = input(3, '平滑', minval=1, inline='DER', group='Directional Energy Ratio')

v_calc  = input('Relative', '计算', options=['Relative', 'Full', 'None'], group='Volume Parameters')
vlookbk = input(20, '回看 (相对)', minval=1, group='Volume Parameters')

uprsi1 = rma(max(change(rsi1SourceInput), 0), rsi1LengthInput)
uprsi2 = rma(max(change(rsi2SourceInput), 0), rsi2LengthInput)
downrsi1 = rma(-min(change(rsi1SourceInput), 0), rsi1LengthInput)
downrsi2 = rma(-min(change(rsi2SourceInput), 0), rsi2LengthInput)
rsi1 = downrsi1 == 0 ? 100 : uprsi1 == 0 ? 0 : 100 - (100 / (1 + uprsi1 / downrsi1))
rsi2 = downrsi2 == 0 ? 100 : uprsi2 == 0 ? 0 : 100 - (100 / (1 + uprsi2 / downrsi2))

vola    =
  v_calc == 'None' or na(volume) ? 1 :
  v_calc == 'Relative' ? f_RelVol(volume, vlookbk) :
  volume

R       = (highest(1) - lowest(1)) / 2                    // R is the 2-bar average bar range
sr      = change(price) / R                                  // calc ratio of change to R
rsr     = max(min(sr, 1), -1)                         // ensure ratio is restricted to +1/-1 in case of big moves
c       = rsr * vola                                            // add volume accel

c_plus  = max(c, 0)                                        // calc directional vol-accel energy
c_minus = -min(c, 0)

// plot(c_plus)
// plot(c_minus)

dem     = wma(c_plus, length) / wma(vola, length)         //average directional energy ratio
sup     = wma(c_minus, length) / wma(vola, length)

// plot(vola, 'Vol Accel')

adp     = 1 * wma(dem, DER_avg)
asp     = 1 * wma(sup, DER_avg)

anp     = adp - asp
anp_s   = wma(anp, smooth)


// plot(rsi1, "RSI", color=#FF0033)
rsi1UpperBand = hline(70, "RSI Upper Band", color=#787B86)
// hline(50, "RSI Middle Band", color=color.new(#787B86, 50))
rsi1LowerBand = hline(30, "RSI Lower Band", color=#787B86)

// plot(rsi2, "RSI", color=#FFFF00)
rsi2UpperBand = hline(70, "RSI Upper Band", color=#787B86)
// hline(50, "RSI Middle Band", color=color.new(#787B86, 50))
rsi2LowerBand = hline(30, "RSI Lower Band", color=#787B86)

c_adp   = color.new(color.aqua, 50)
c_asp   = color.new(color.orange, 50)
c_zero  = color.new(color.yellow, 70)
c_fd    = color.new(color.green, 80)
c_fs    = color.new(color.red, 80)
c_up    = color.new(#33ff00, 0)
c_dn    = color.new(#ff1111, 0)
up      = anp_s >= 0

//strategy(title='VMC', shorttitle='VMC', overlay=true, precision=3, commission_value=0.025, default_qty_type=strategy.cash, default_qty_value=10000, initial_capital=10000)

//=== Buy/Sell ===
closeStatus = strategy.openprofit > 0 ? 'win' : 'lose'
// long_entry = (signalColor == color.lime and wtCross and up)
// long_exit_entry = (signalColor == color.red or sellSignal or sellSignalDiv)
// short_entry = (signalColor == color.red and wtCross and not up)
// short_exit_entry = (signalColor == color.lime or buySignal or buySignalDiv)

long_entry = wt2 < wt1 //and up and rsi2 > rsi1
long_exit_entry = signalColor == color.red or sellSignal or sellSignalDiv
short_entry = wt2 > wt1 //and not up and rsi2 < rsi1
short_exit_entry = signalColor == color.lime or buySignal or buySignalDiv

alertcondition(long_entry, 'Buy', 'Long entry')
alertcondition(long_exit_entry, 'Buy', 'Long exit')
alertcondition(short_entry, 'Sell', 'Short entry')
alertcondition(short_exit_entry, 'Sell', 'Short exit')

strategy.entry('long', strategy.long, when=long_entry)
strategy.close('long', when=long_exit_entry, comment=closeStatus)

strategy.entry('short', strategy.short, when=short_entry)
strategy.close('short', when=short_exit_entry, comment=closeStatus)

// stopPer = input(100, title='Stop Loss %', type=input.float) / 100
// takePer = input(100, title='Take Profit %', type=input.float) / 100

// // Determine where you've entered and in what direction
// longStop = strategy.position_avg_price * (1 - stopPer)
// shortStop = strategy.position_avg_price * (1 + stopPer)
// shortTake = strategy.position_avg_price * (1 - takePer)
// longTake = strategy.position_avg_price * (1 + takePer)

// if strategy.position_size > 0
//     strategy.exit(id="Close Long", stop=longStop, limit=longTake)
// if strategy.position_size < 0
//     strategy.exit(id="Close Short", stop=shortStop, limit=shortTake)
相关内容
- CCI+EMA与RSI交叉策略
- 大鲷鱼警报R3.0+柴金波动条件+TP RSI
- RSI-买卖信号策略
- 最佳TV策略
- RSI枢轴点背离策略
- Hull-4ema
- Heikin Ashi趋势
- Ichimoku 云平滑振荡策略
- 双重范围过滤器策略
- Ichimoku云平滑振荡策略
更多内容