zdmre的RSI策略
Author: 雨幕(youquant), Date: 2022-05-25 10:12:36Tags: RSI
RSI的传统解释和用法规定,70或以上的值表明证券超买或高估,可能会出现趋势逆转或纠正性价格回调。RSI读数为30或以下表示超卖或低估情况。
30=超卖 70=超买
感谢DieGobelMonte的建议。
回测测试
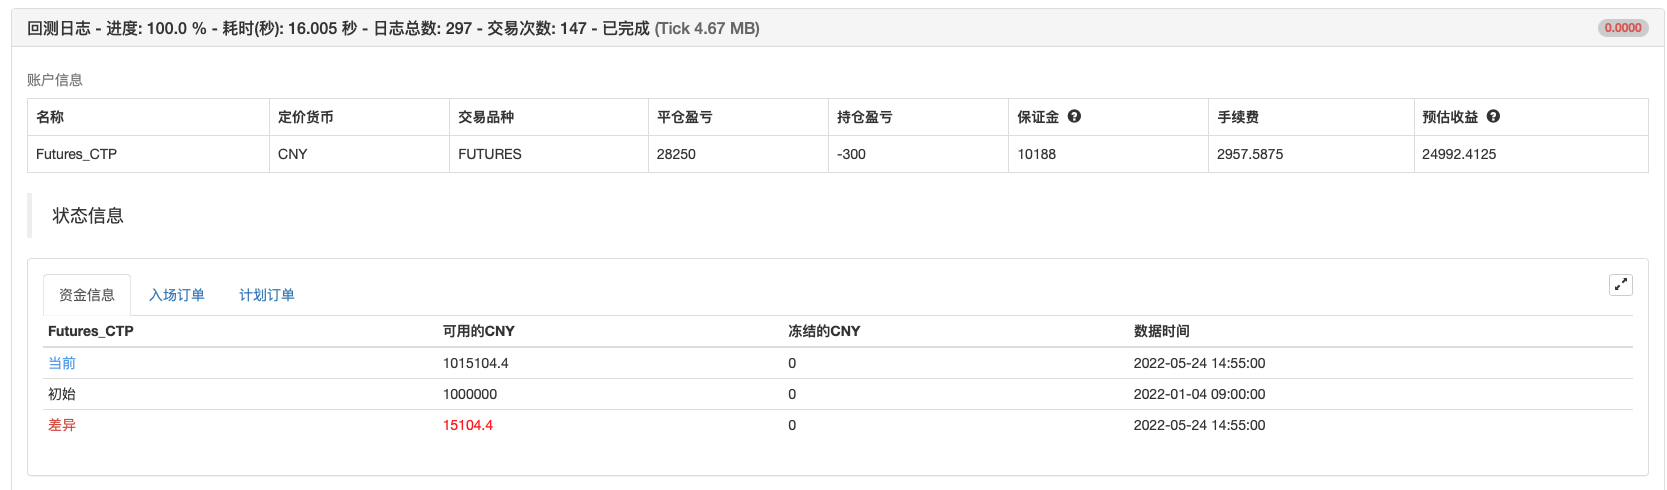
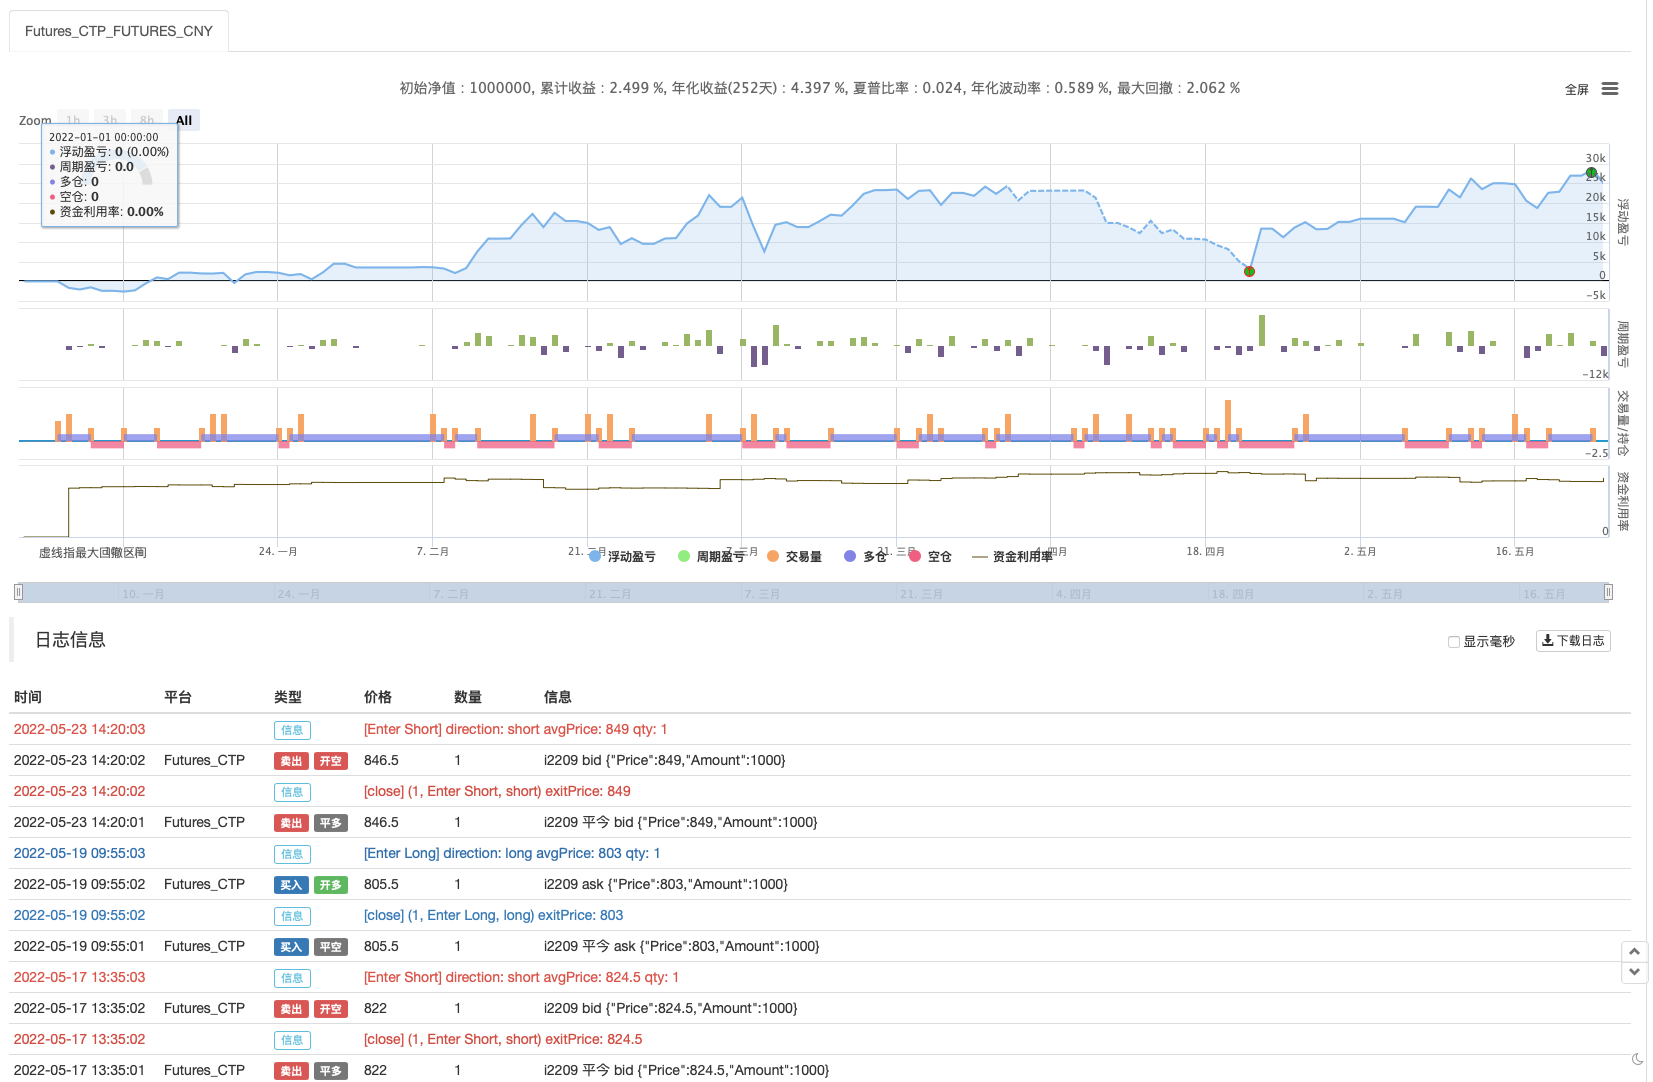
/*backtest
start: 2022-01-01 09:00:00
end: 2022-05-24 15:00:00
period: 5m
basePeriod: 1m
exchanges: [{"eid":"Futures_CTP","currency":"FUTURES"}]
args: [["v_input_int_1",12],["ContractType","i888",360008]]
*/
// This source code is subject to the terms of the Mozilla Public License 2.0 at https://mozilla.org/MPL/2.0/
// © zdmre
//@version=5
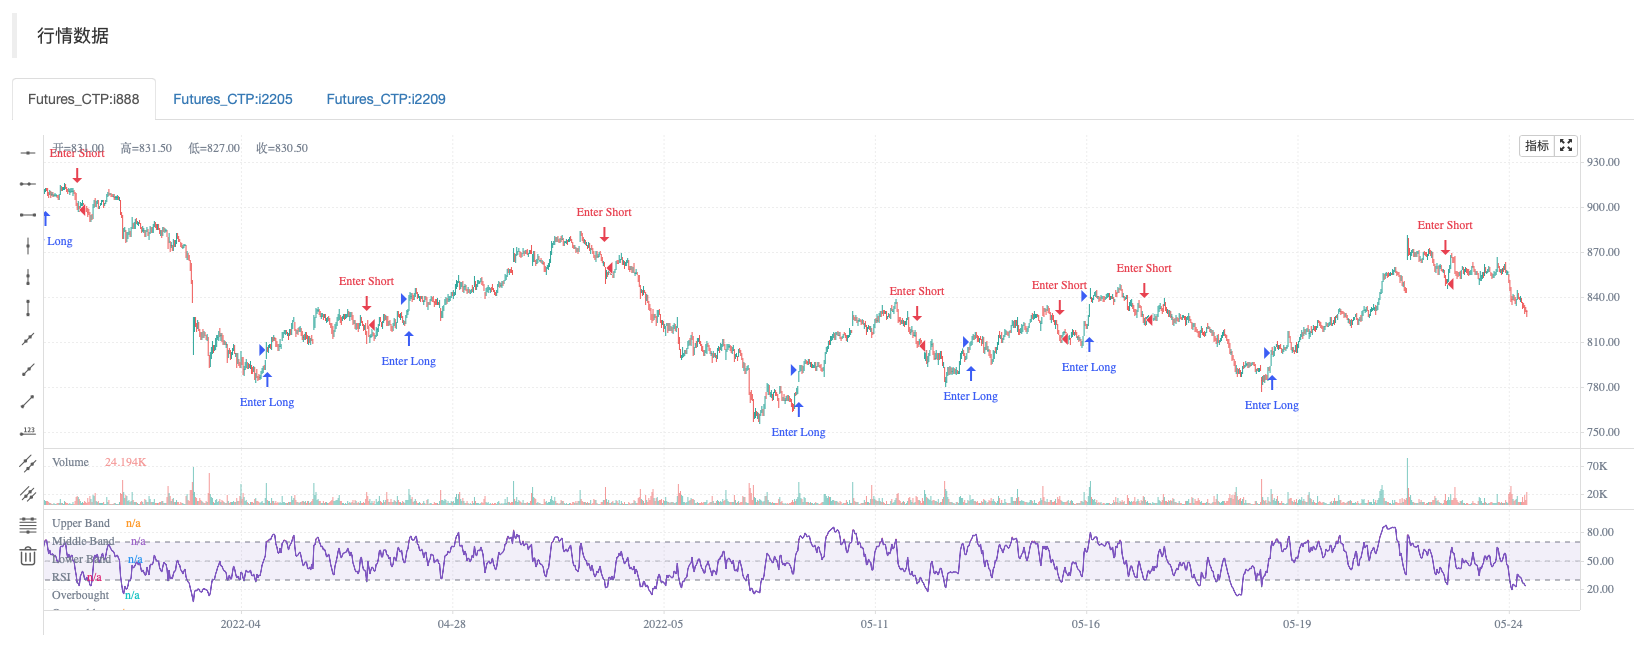
indicator("RSI by zdmre", overlay=false)
len = input.int(60, minval=1, title='周期')
src = input(hl2, '数据源')
up = ta.rma(math.max(ta.change(src), 0), len)
down = ta.rma(-math.min(ta.change(src), 0), len)
rsi = down == 0 ? 100 : up == 0 ? 0 : 100 - 100 / (1 + up / down)
plot(rsi, 'RSI', color=color.new(#7E57C2, 0))
band1 = hline(70, "Upper Band", color=#787B86)
bandm = hline(50, "Middle Band", color=color.new(#787B86, 50))
band0 = hline(30, "Lower Band", color=#787B86)
fill(band1, band0, color=color.rgb(126, 87, 194, 90), title="Background")
ob= ta.cross(rsi, 70) == 1 and rsi >= 70
os = ta.cross(rsi, 30) == 1 and rsi <= 30
plot(ob ? rsi : na ,title='Overbought', style=plot.style_circles, color=color.new(color.red, 0), linewidth=5)
plot(os ? rsi : na ,title='Oversold ', style=plot.style_circles, color=color.new(color.green, 0), linewidth=5)
if ob
strategy.entry("Enter Long", strategy.long)
else if os
strategy.entry("Enter Short", strategy.short)
相关内容
- RSI MTF Ob+Os策略
- RSI-买卖信号策略
- TMA-Legacy策略
- CCI+EMA与RSI交叉策略
- 大鲷鱼警报R3.0+柴金波动条件+TP RSI
- 最佳TV策略
- MTF RSI&STOCH策略
- BB-RSI-ADX指标入场点策略
- RSI和BBand同时超卖
- RSI枢轴点背离策略
更多内容